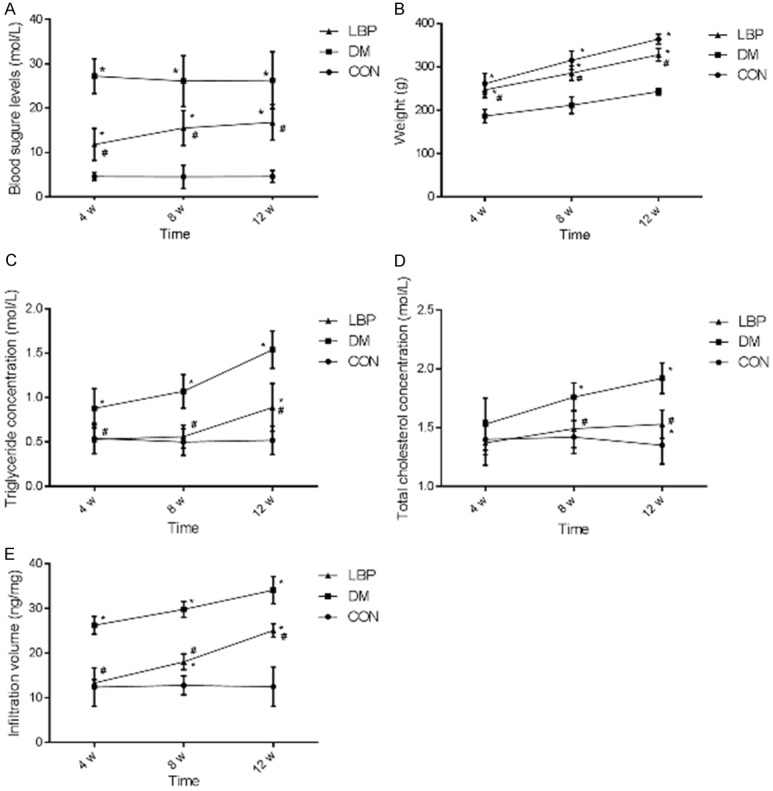
Figure 2.

Effects of LBP on blood glucose levels, blood lipid levels, weight and EB infiltration capacity of diabetic rats. After the rats modeling and LBP treatment, the blood glucose level, weight, TG, TC and EB infiltration capacity was measured at the 4, 8 and 12 weeks in CON, DM and LBP groups as shown in (A-E) respectively. CON: control group treated with normal saline; DM: model group treated with normal saline; LBP: model group treated with LBP. Overall retina was shown in frame. *P<0.05 vs. CON group, #P<0.05 vs. DM group.
