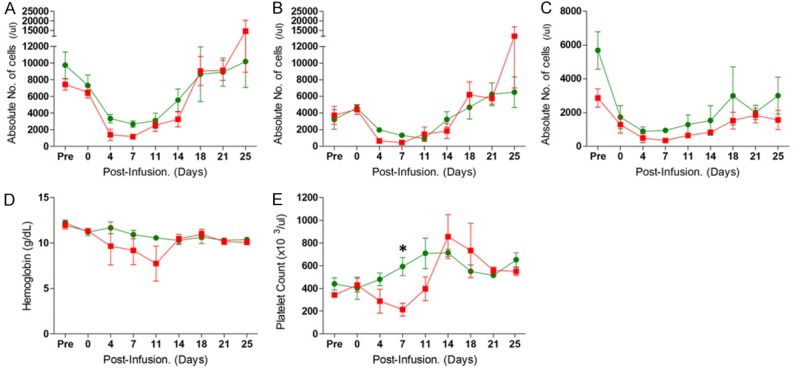
Figure 1.

Whole blood cell monitoring in the experimental groups after induction therapy with cyclophosphamide and fludarabine. The absolute numbers of white blood cells (A), neutrophils (B), and lymphocytes (C) were counted after induction in Groups 1 and 2. Hemoglobin (D) and platelet counts (E) are shown. Red squares represent the kinetics of Group 1 with 120 mg/kg CP and 120 mg/m2 FDR. Green circles represent the kinetics of Group 2 with 60 mg/kg CP and 240 mg/m2 FDR. These results are expressed as average ± SEM. *P<0.05 versus the two groups at same time point.
