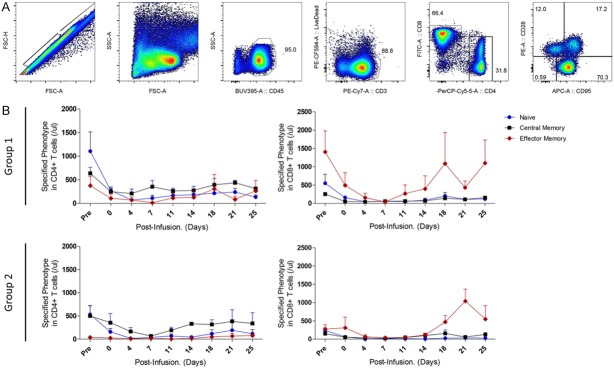
Figure 3.
The kinetics of T cell subpopulations after CP and FDR administration. A gating strategy of naïve and memory phenotype T-cells in periphery is presented (A). The kinetics of T cell subsets were chronologically measured by flow cytometric analysis (B). Blue circles represent naïve (CD28+CD95-) T cells. Black squares represent central memory (CD28+CD95+) cells, and red diamonds represent effector memory (CD28-CD95+) cells. Data are expressed as average ± SEM.

