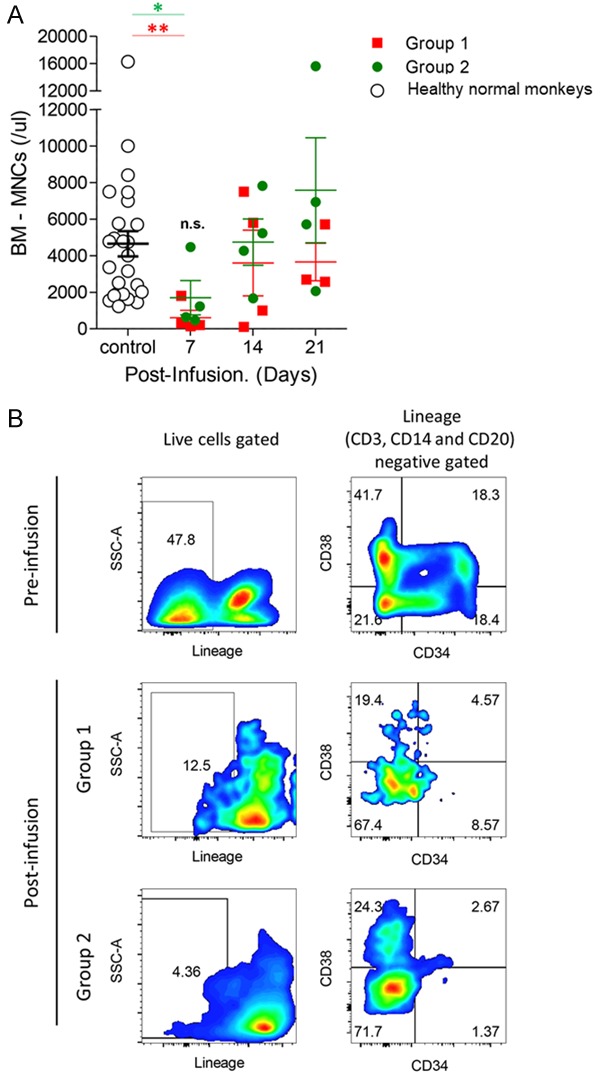
Figure 4.

The suppressive effect on bone marrow cells in the experimental regimens. To evaluate the suppressive effects of a combination drug of CP and FDR in bone marrow, bone marrow mononuclear cell (BM-MNC) count (A) was measured at the indicated time points. Red squares represent the BM-MNC of Group 1, green circles represent the BM-MNC of Group 2, and white circles represent the BM-MNC of healthy normal cynomolgus monkeys (n=25, mean: 4652.86 cells/µl, SEM: 691.786 cells/µl). Representative FACS dot plots of hematopoietic stem cells of expression of lineage (CD3, CD14, and CD20), CD34, and CD38 pre- and post-infusion (B). *P<0.05, and **P<0.005 versus the group compared as healthy normal monkeys.
