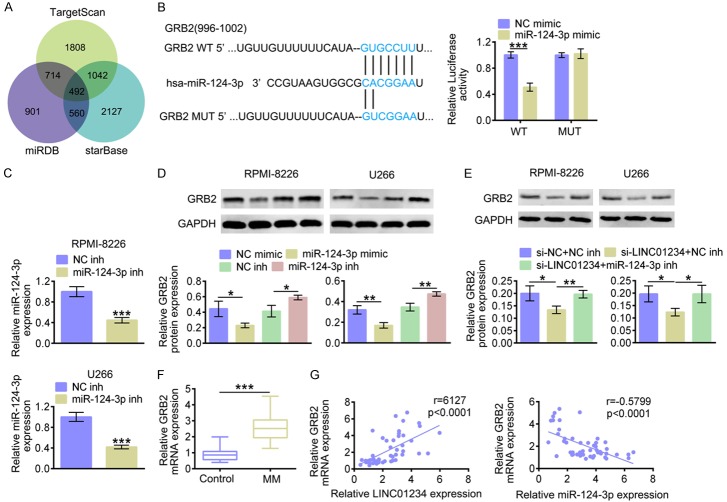
Figure 5.
miR-124-3p negatively regulates GRB2 through targeting its 3’UTR. A. Analysis on miR-124-3p’s potential targets using TargetScan, miRDB and starBase. B. The predicted seed-recognition sites between 3’UTR of GRB2 and miR-124-3p are marked in blue. The relative luciferase activity of the GRB2 3’UTR reporter plasmid was detected in RPMI-8226 or U266 cells after transfecting with miR-124-3p mimics (miR-124-3p mimic) or the corresponding control (NC mimic). The mutant GRB2 3’UTR reporter was also used as a control (Student’s t-test). C. The relative miR-124-3p expression levels in RPMI-8226 or U266 cells after transfecting with miR-124-3p inhibitors (miR-124-3p inh) or the corresponding control (NC inh), as determined using qRT-PCR (Student’s t-test). D. The protein level of GRB2 in RPMI-8226 or U266 cells after transfecting with miR-124-3p mimics (miR-124-3p mimic), miR-124-3p inhibitors (miR-124-3p inh) or the corresponding controls (NC mimic or NC inh), as determined using western blotting. Relatively quantitative results were determined by Image J and shown as histogram (Student’s t-test). E. The protein level of GRB2 in RPMI-8226 or U266 cells after transfecting with si-LINC01234+NC inh, si-LINC01234+miR-124-3p inh or the corresponding controls (siNC+NC inh), as determined using western blotting. Relatively quantitative results were determined by Image J and shown as histogram (One-way ANOVA). F. The relative GRB2 mRNA expression level in MM tissues (MM, n=50) and normal control tissues (Control, n=50), as determined using qRT-PCR (Student’s t-test). G. The Pearson correlation analysis on GRB2 mRNA expression and LINC01234/miR-124-3p level. The data are expressed as mean ± SEM, *P < 0.05; **P < 0.01; ***P < 0.001.

