Figure 1.
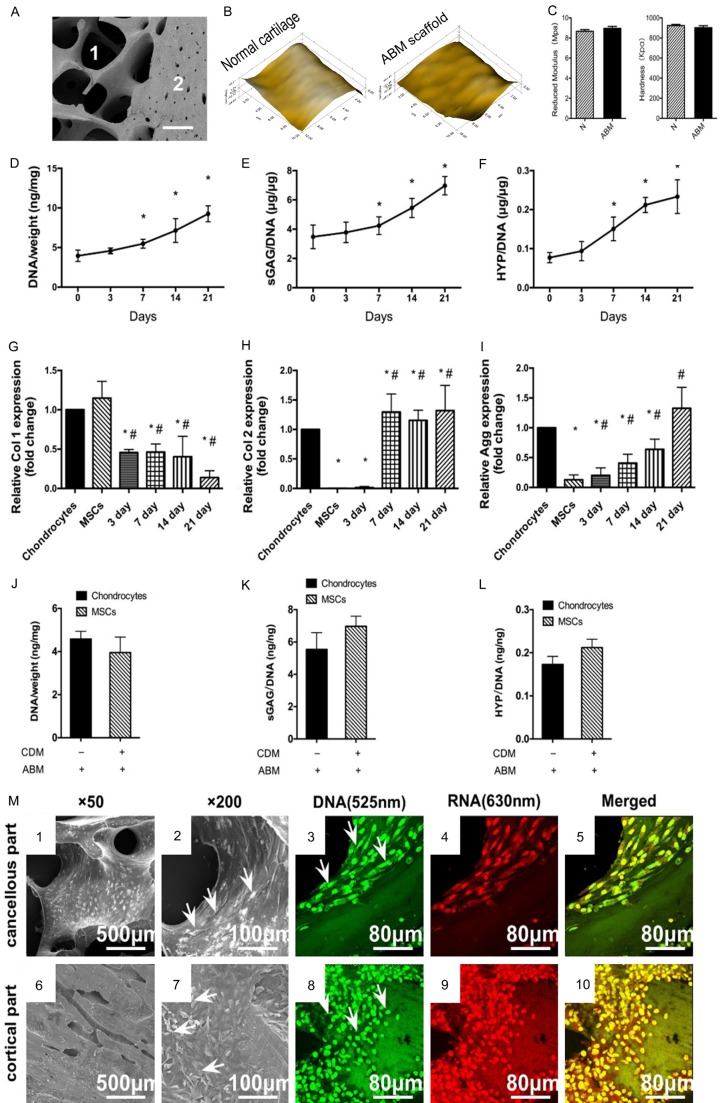
The biomechanical properties of ABM scaffold and the in vitro cell growth, chondrogenesis and the cell attachment on ABM. (A) SEM image of The ABM scaffold. 1 indicate the cancellous part. 2 indicate the cortical part. (B) Microscopic geomorphology of normal cartilage and ABM surface was acquired during nanoindentation. (C) The reduced modulus and the hardness of normal cartilage and ABM were calculated during nanoindentation (n=6, *P<0.05). (D-F) MSCs were cultured in the ABM scaffold. DNA, GAG, and hydroxyproline contents were measured for over 21 days. (n=6, *P<0.05). (G-I). Expressions of collagen type I, collagen type II, and aggrecan for over 21 days. (n=6, *P<0.05 vs chondrocytes, #P<0.05 vs MSCs). DNA (J) GAG (K) and HYP (L) production by chondrocytes cultured alone in the ABM scaffold and MSCs cultured in ABM scaffold with chondrogenesis medium in vitro. (M) The attachment of MSCs on different parts of the ABM scaffold. Scanning electron microscopy images show the growth of MSCs on the surface of cancellous parts (1, 2) and cortical parts (6, 7) of the ABM at different magnifications (original magnification: 1 and 6: *200, 2, and 7: *500). Arrows indicate the typical cells grown on different parts of the scaffold. Confocal laser microscopic images show the growth of MSCs on the cancellous parts (3-5) of the ABM and the cortical parts (8-10). The MSCs grown on both parts of the scaffold were stained with green and red fluorescence uniformly (no apoptotic or necrotic cells). Green: the intercalated DNA stained by acridine orange with fluorescence at 515-545 nm. Red: the electrostatic RNA stained by acridine orange with fluorescence at 590-620 nm. Yellow: merged from (3 and 4) or (8 and 9). Magnification: *60.

