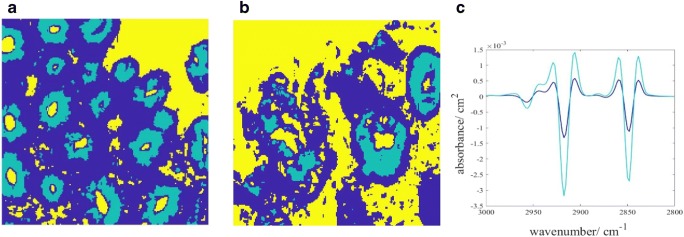
Fig. 6.
Representative colour-coded K-means clustered images of healthy colon biopsy sections of a test and b training model. Cluster represented in light blue is for areas dominated by goblet cells (denoted as cluster 2), dark blue for basal membrane (denoted as cluster 1), and yellow for areas without tissue. c Average second derivative spectra of the corresponding clusters in the high wavenumber spectral region (3000–2800 cm−1), following the colour code in K-means cluster

