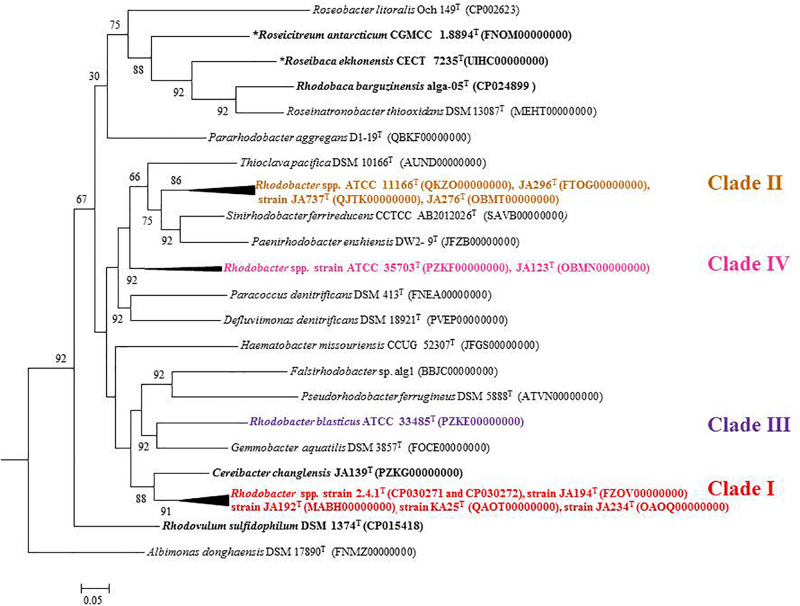
FIGURE 3.
Phylogenetic tree constructed using the 92 bacterial core gene sequences. The tree was constructed using MEGA 7 software. Bootstrap percentages refer to NJ/ML/ME analysis. Phototrophic bacteria are indicated by bold letters and aerobic anoxygenic phototrophic bacteria with bold letters and star.

