Fig. 2.
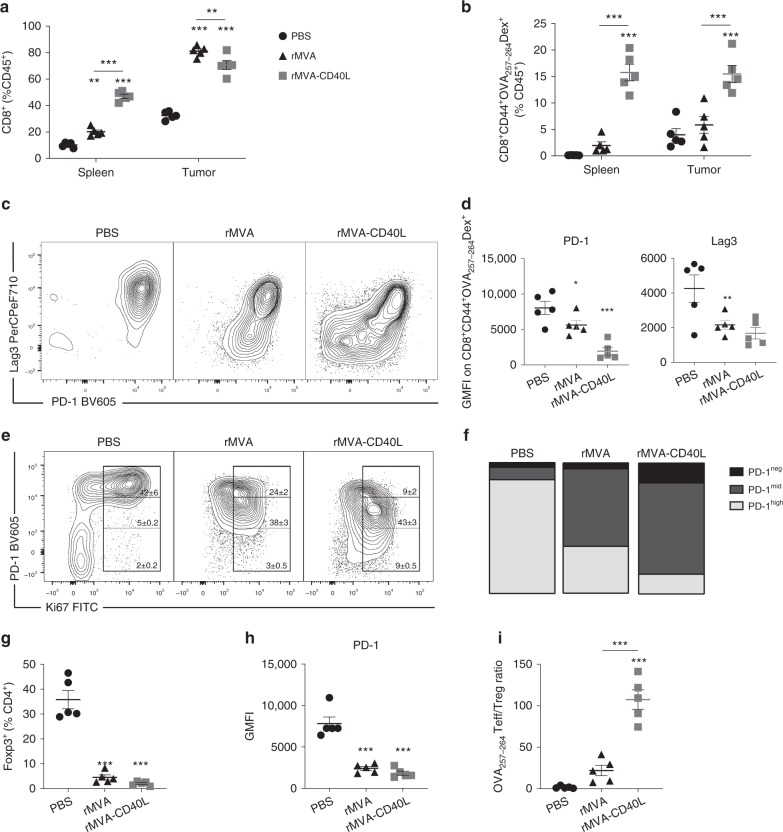
rMVA-CD40L increases intratumor T cell infiltration of non-exhausted CD8+ T cells. B16.OVA tumor bearers were immunized when tumors reached at least 50 mm3 in volume. Seven days later, mice were killed for further analysis (n = 5 mice/group). a Frequency of CD8+ T cells among leukocytes in the spleen and tumor tissues. b Distribution of OVA257-264-specific CD8+ T cells in different organs upon immunization. c Representative dot plot of PD-1 and Lag3 co-expression in tumor-infiltrating OVA257-264-specific CD8+ T cells. d GMFI of PD-1 and Lag3 on tumor-infiltrating OVA257-264-specific CD8+ T cells. e Representative dot plot of Ki67 and PD-1 expression on tumor-infiltrating CD8+ T cells showing mean ± SEM, representative of at least two independent experiments. f Bar chart representing PD-1 expression on Ki67+ TILs shown in e. g Frequency of tumor-infiltrating FoxP3+ Treg among CD4+ T cells. h GMFI of PD-1 on tumor-infiltrating Treg. Data expressed as mean ± SEM, representative of at least two independent experiments. i OVA257-264-specific CD8+ T cell (OVA257-264 Teff) to Treg ratio. Data expressed as mean ± SEM, representative of at least two independent experiments in d, f, g, h, and i. One-way ANOVA comparing treatment groups. a, b Two-way ANOVA comparing cell frequencies in analyzed organs upon treatment. Statistics were run comparing treatment vs. PBS. *p < 0.05; **p < 0.01; ***p < 0.005

