Fig. 1.
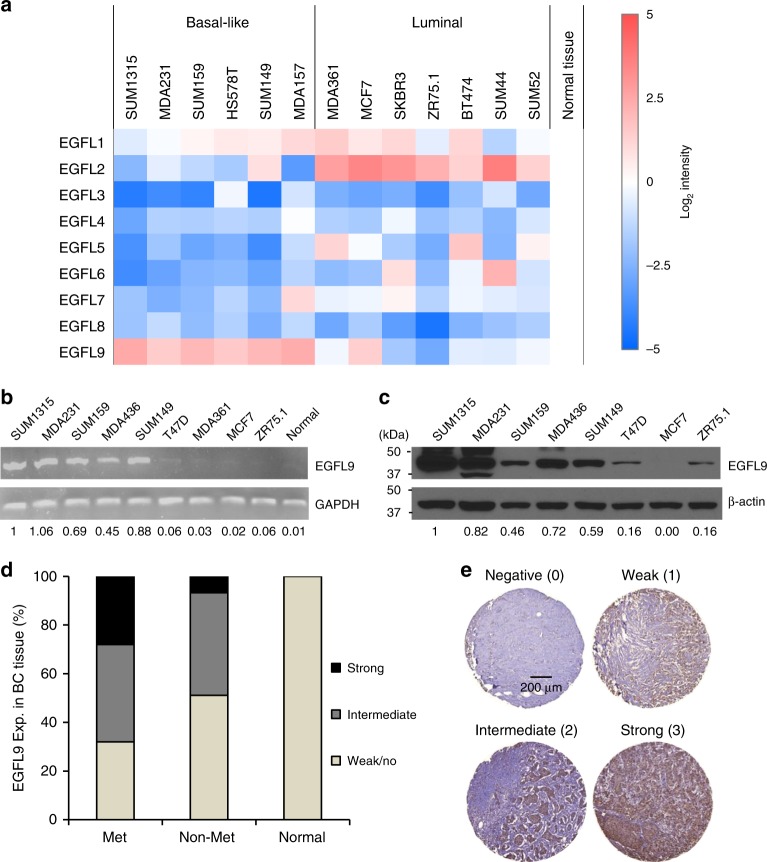
Expression of EGFL9 in breast cancer. a Heat map showing expression levels of the EGF-like family genes in a set of breast cancer cell lines cells. Data are normalized to GAPDH expression. Log2 intensity scale is shown on the right. b Expression of EGFL9 at the RNA level in human breast cancer cell lines. The top panel shows EGFL9 RNA expression examined by RT-PCR. The bottom digits show quantitation of the RT-PCR results. GAPDH was used as a loading control for RNA. c Expression of EGFL9 at the protein level in human breast cancer cell lines. The top panel shows the EGFL9 protein expression level examined by western blotting. The bottom digits show the quantitation of the EGFL9 protein expression level examined by western blot analysis. β-Actin was used as a protein loading control. d Summary of the EGFL9 IHC results in human breast tumor tissue microarray. e Expression of EGFL9 protein in human breast tumors. The panels show representative figures of the immunohistochemistry assay. 0 is no staining, 1 is an example of weak staining, 2 is intermediate staining, 3 is strong staining. Scale bar: 200 µm

