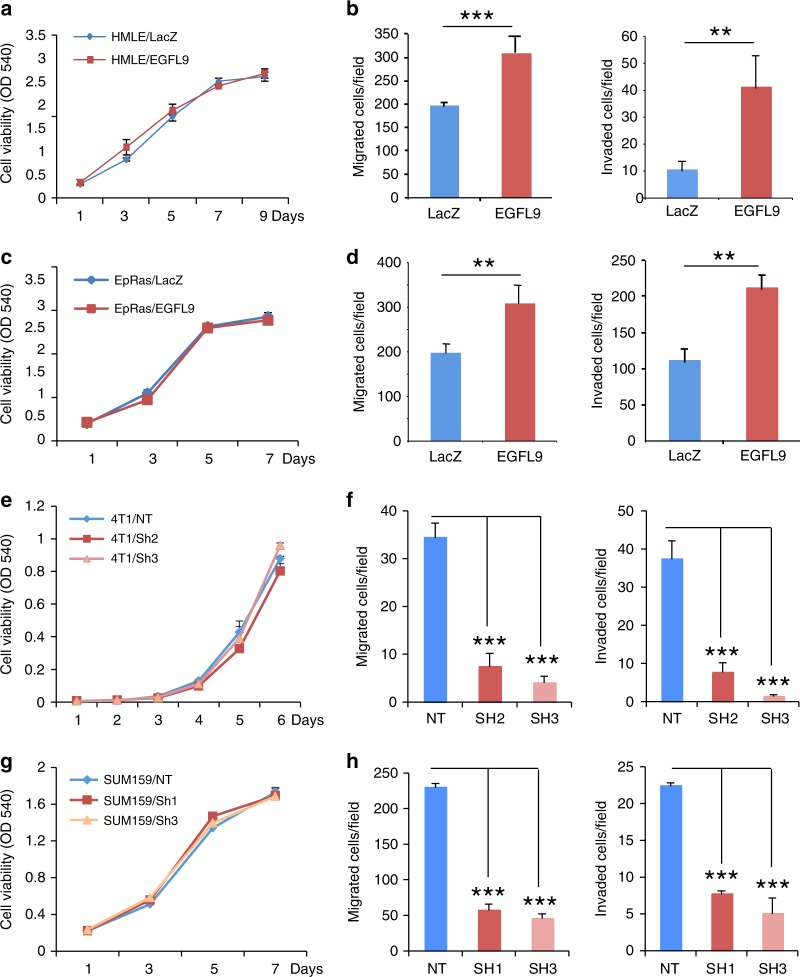
Fig. 2.
The effect of EGFL9 on cell motility in vitro. a The ectopic expression of EGFL9 does not change cell proliferation in the HMLE cell line. Cell proliferation was measured by MTT assay over 9 days. b The ectopic expression of EGFL9 increased cell migration (left panel, ***P < 0.001) and invasion (right panel, **P < 0.01) in HMLE cells. c The ectopic expression of EGFL9 does not change cell proliferation in the EpRas cell model. Cell proliferation was measured by MTT assay over 7 days. d The ectopic expression of EGFL9 increased cell migration (left panel, **P < 0.01) and invasion (right panel, **P < 0.01) in EpRas cells. e Knockdown of EGFL9 expression does not affect the cell proliferation in 4T1 cells. Cell proliferation was measured by MTT assay over 6 days. f Knockdown of EGFL9 expression significantly decreased migration (left panel, shRNA2/non-target control = 21% and shRNA3/non-target control = 12%, ***P < 0.001) and invasion (right panel, shRNA2/non-target control = 19% and shRNA3/non-target control = 5.5%, ***P < 0.001) in 4T1 cells. g Knockdown of EGFL9 expression does not affect proliferation of SUM159 cells. Cell proliferation was measured by MTT assay over 7 days. h Knockdown of EGFL9 expression decreased migration (left panel, shRNA1/non-target control = 22.2% and shRNA3/non-target control = 21%, ***P < 0.001) and invasion ability (right panel, shRNA1/non-target control = 32% and shRNA3/non-target control = 16%, ***P < 0.001) in SUM159 cells. All experiments were performed in triplicate. The data number was the mean value from five randomly selected field views. Each bar represents the mean ± SEM (standard error of the mean). P values were determined by unpaired two-tailed t-test

