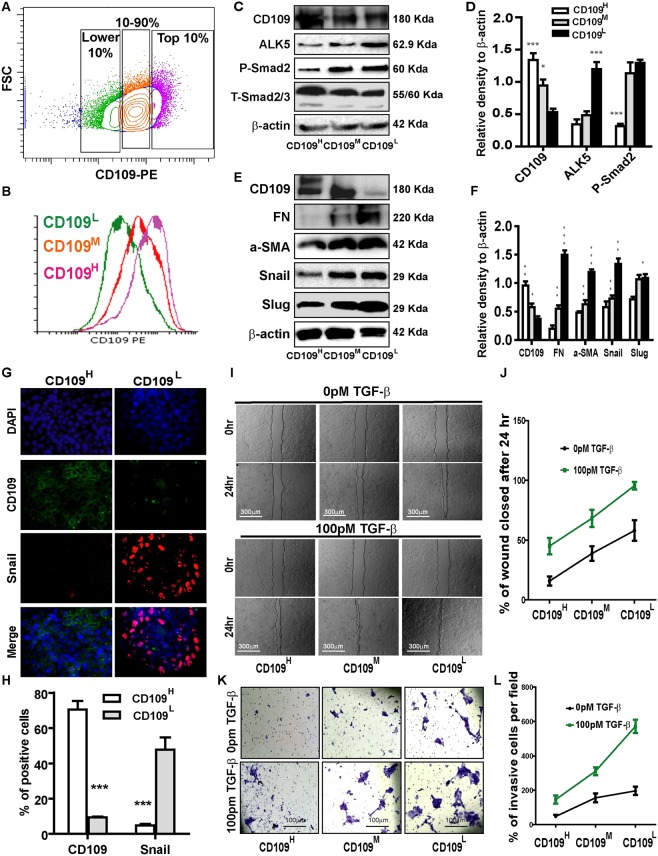
Figure 2.
CD109 expression levels inversely correlate with TGF-β signaling, EMT marker expression, cellular migration and invasion. (A) Isolation of CD109H, CD109M, and CD109L subpopulations of A431 SCC cells by flow cytometry based on their CD109 expression levels. (B) Sorted cells were put in culture for three weeks and then re-analyzed by flow cytometry for CD109 expression, which showing that they maintain their respective CD109 expression profiles. (C) Representative image and (D) quantification of Western blot analysis of TGF-β receptor I (ALK5) and P-Smad2 in CD109H, CD109M CD109L cells, showing that CD109 expression levels are inversely correlated with TGF-β signalling. (E) Representative image and (F) quantification of Western blot analysis for EMT markers in CD109H, CD109M, CD109L cells, respectively. EMT markers expressions are inversely correlated with CD109 expression. (G) Representative image and (H) quantification of Immunofluorescence microscopy for CD109 (Green), Snail (Red) and DAPI (Blue) in CD109H and CD109L SCC cells, respectively, showing that CD109H cells exhibited decreased Snail expression. (I) Representative images and (J) quantification of wound-healing assays on CD109H, CD109M, and CD109L subpopulations as indicated, revealing that the levels of CD109 were inversely corelated with the migration of SCC cells. Cell migration was expressed as a percentage of the scratch area filled by migrating cells at 24 h post scratch: migration rate = (T0 hr scratch width − T24 hr scratch width)/T0 hr scratch width) × 100%. (K) Representative images and (L) quantification of an invasive assay done on equal number of CD109H, CD109M, and CD109L subpopulations. 10,000 cells were seeded on a BioCoat™ Matrigel® Invasion Chamber for 24 hours. Cells that invaded through the matrigel-coated membrane were stained with 1% crystal violet, photographed, and counted. The levels of CD109 are inversely corelated with cell invasion. All the results are expressed as the mean ± S.D. of three independent experiments. Significance is calculated using a One-Way ANOVA *P < 0.05. **P < 0.01 and ***P < 0.001. The graphs display the raw data. Scale bars: 30 μm, 100 μm and 300 μm, as indicated.

