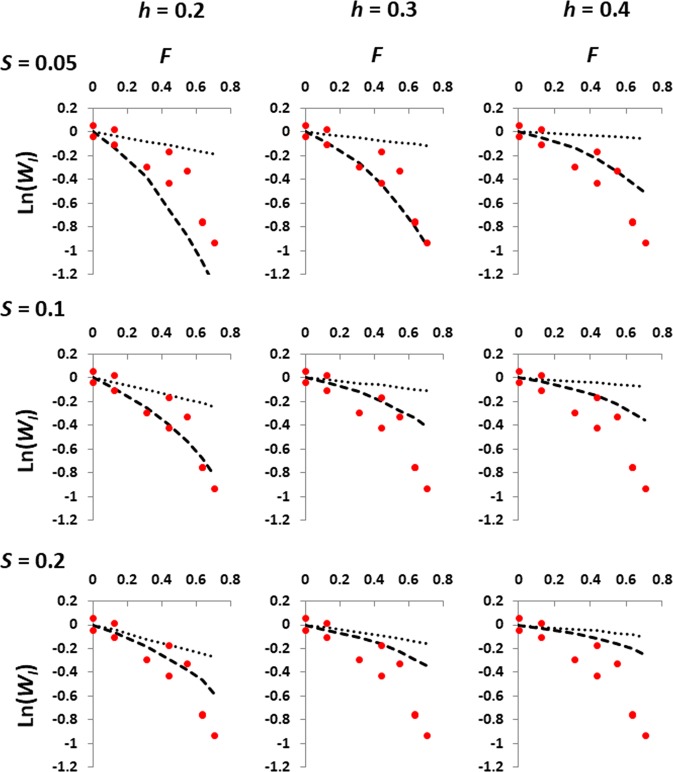
Fig. 5.
Comparison between simulation results (lines) and experimental data (dots), including Experiments I and II. Each panel shows the decline in log relative fitness, ln(WI), for increasing values of the expected genealogical inbreeding coefficient (F) in the full-sib lines. Averaged simulation results assuming a multiplicative (non-epistatic) model are shown as dotted thin lines, whereas averaged results assuming an epistatic model of variation are shown as broken thick lines. The epistatic model (high-order homozygous fitness model) assumes that homozygous fitnesses of epistatic loci are raised to a power equal to the total number of homozygous mutations carried by the individual if there are more than one. Deleterious mutations are assumed to appear with haploid rate U = 0.05, variable effects obtained from a gamma distribution with shape parameter β = 2, mean homozygous effect s and variable dominance coefficients with mean h

