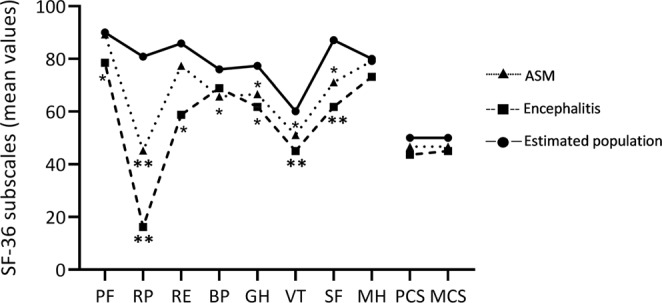
Figure 2.

Mean scores of SF-36 subscales, PCS and MCS of patients with aseptic meningitis and encephalitis compared to the estimated population mean at follow-up at two months. Asterisks denotes significant difference vs estimated population mean; *p < 0.05, **p ≤ 0.001. For encephalitis both PCS (p = 0.005) and MCS (p = 0.014) were below the population mean, while for ASM, only PCS was below (p = 0.042). PF: Physical functioning, RP: Role physical, RE: Role emotional, BP: Bodily pain, GH: General health, VT: Vitality, SF: Social functioning, MH: Mental health, PCS: Physical Component Summary score, MCS: Mental Component Summary score.
