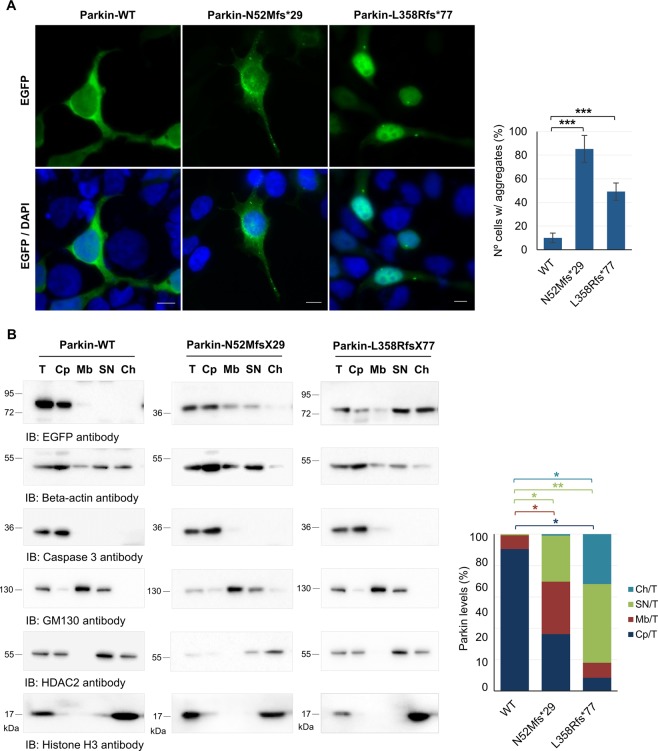
Figure 3.
Truncating variants change the subcellular localization of parkin. (A) Localization of EGFP-tagged parkin clones in HEK293T cells. EGFP was directly visualized. Photographs were acquired using a Zeiss Axio Imager Z1 microscope. Bars, 10 μm. The percentage of cells with aggregates is also shown (graph). Data are presented as the mean ± SD of three independent experiments; ***p < 0.001 (ANOVA/Tukey). (B) Subcellular fractionation of HEK293T cells expressing parkin clones. Presence of parkin in each fraction was analyzed by immunoblotting with anti-EGFP antibody and normalized to the specific marker of each fraction. T, total fraction; Cp, cytoplasm fraction; Mb, membrane fraction; SN, soluble nuclear fraction; Ch, chromatin-bound nuclear fraction. Original blots are presented in Supplementary Fig. S4. Quantification data (graph) are presented as the mean ± SD of three independent experiments; *p < 0.05, **p < 0.01 (one-way ANOVA/Tukey).

