Fig. 1.
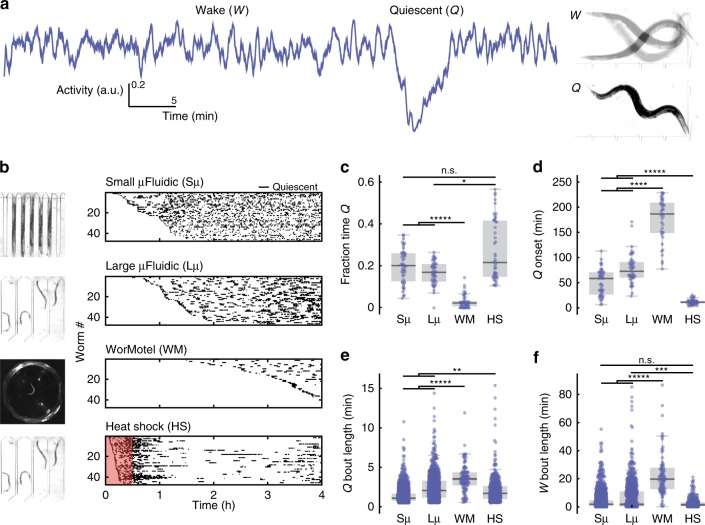
Quiescence dynamics are strongly affected by microfluidic environments. a Characteristic worm quiescence in a microfluidic chamber. (Left) 1-h activity trace from a worm swimming in a microfluidic chamber, calculated by subtracting consecutive frames to quantify movement (see “Methods” section). Quiescence is hallmarked by a clear drop in animal activity to near zero. (Right) 1-s overlap of frames shows the animal swimming during the wake period (W) and immobile during quiescence (Q). b All quiescent bouts recorded from animals in a small microfluidic chamber (50 μm width), large microfluidic chamber (500 μm width), WorMotel multi-well PDMS device, and large microfluidic device during a 30 min heat shock at 30 °C (see inset images). Raster plots show the bouts recorded from each animal during a 4 h imaging period (n = 47 animals for each condition). Experiments represented in the raster plots are sorted by the onset of the first detected sleep bout. c–f Quantitative sleep metrics. Sμ small microfluidic chambers, Lμ large microfluidic chambers, WM WorMotel, HS first hour of heat shock. c The total fraction of time each animal spent in the quiescent state. d Onset time of the first quiescent bout. e Length of individual quiescent bouts. f Length of individual wake bouts, excluding the first period of wake after animals are loaded into the chamber. (n = 47 animals for each condition; *p < 0.05, **p < 0.01, ***p < 0.001, ****p < 0.0001, *****p < 0.00001; Kruskal–Wallis with a post hoc Dunn–Sidak test). Source data is available as a Source Data file

