Fig. 2.
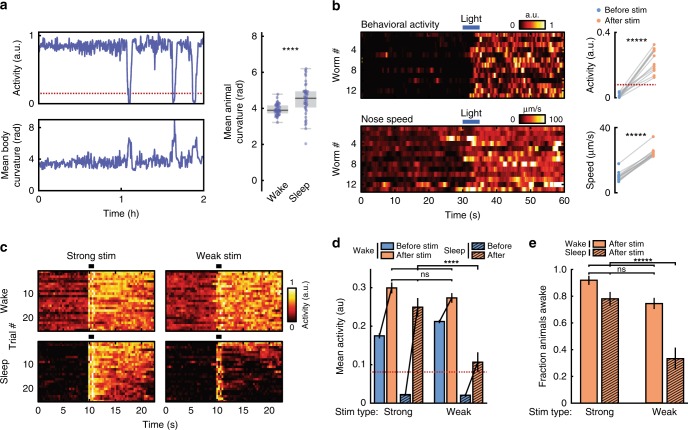
Sleep states show stereotypical posture, reversibility, and a decreased response to weak stimuli. a C. elegans show increased body curvature during sleep. (Left) Example of behavioral activity and normalized body curvature for a single animal. Dotted line indicates sleep threshold. (Right) Average body curvature during wakefulness and sleep across all animals (from Large microfluidic data in Fig. 1, n = 47 animals, ****p < 0.0001, unpaired t-test). b The sleep state is reversible. (Left) Heatmaps of behavioral activity (top) and nose speed (bottom) for quiescent animals that received a 5 s light pulse at t = 30 s. (Right) Mean behavioral activity (top) and nose speed (bottom) of each animal before and after stimulation. Dotted line indicated sleep threshold. (n = 13 worms, *****p < 0.00001, paired t-test). c–e Quiescent animals have a decreased response to weak sensory stimuli. c Heatmaps of activity from awake and sleeping animals that received strong or weak mechanical stimuli from microfluidic valves (Supplementary Movie 4, 5). For each condition, only the 25 trials with the highest mean activity post stimulation are shown. “Wake” indicates trials in which animals were awake but have a below-average activity before stimulation. “Sleep” indicates trials in which animals were quiescent before stimulation. Heatmaps contain an ~2 s long stimulation artifact beginning at 10 s due to movement from microfluidic valves. d Mean behavioral activity before and after mechanical stimulation from the trials in c. Dotted line indicates sleep threshold. In all cases, average activity significantly increases after the stimulation (largest p-value = 0.002, paired two-sided t-test). However, the behavioral activity after stimulation is significantly different when quiescent animals received weak mechanical stimuli (Error bars are sem; Strong-Wake n = 108, Strong-Sleep n = 51, Weak-Wake n = 176, Weak-Sleep n = 29; ****p < 0.0001, ns not significant, Kruskal–Wallis with a post hoc Dunn–Sidak test). e Fraction of animals awake following mechanical stimuli (Error bars are standard deviation, calculated by bootstrapping each data set with 5000 iterations; ns not significant, *****p < 0.00001; significance was calculated by data resampling 5000 iterations and a post hoc Bonferroni correction). Source data is available as a Source Data file

