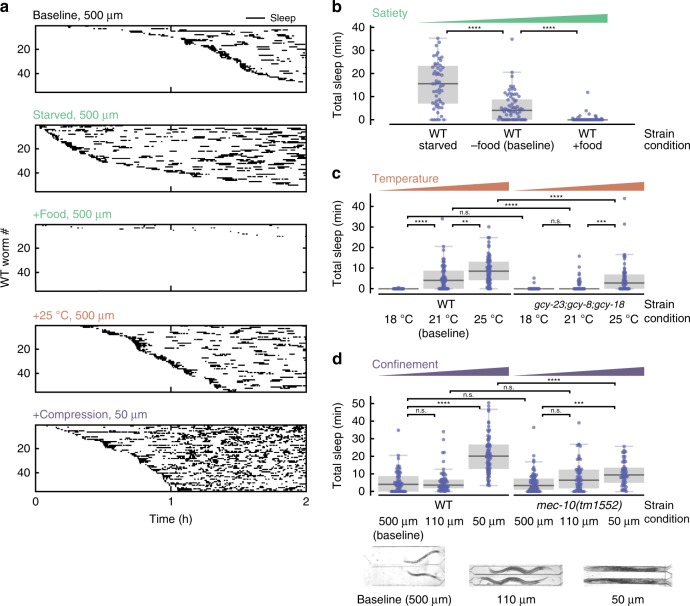
Fig. 6.
Microfluidic-induced sleep is regulated by satiety and multiple sensory circuits. a Detected sleep bouts for WT animals in several experimental conditions. Raster plots show detected sleep bouts during a 2 h imaging period. “Baseline” indicates the standard experimental conditions: 500 μm chamber width, no food in the buffer, and a 22 °C temperature. “Starved” indicates animals that were starved prior to the assay. “+Food” indicates conditions in which E. coli OP50 was added into the buffer during recordings. “+Heat” indicates imaging conditions where the temperature was raised to 25 °C. “+Compression” indicates that animals were partially immobilized in 50 μm-wide chambers. See micrographs under d for chamber geometries. In all cases, the sleep phenotype varies dramatically from the baseline. Only the 55 animals that displayed the most sleep are plotted for clarity. b Total WT sleep under varying satiety conditions. As satiety increases from Starved to +Food, animals exhibit less microfluidic-induced sleep (from left to right on the plot the number of animals n = 55, 68, and 67). c Total microfluidic-induced sleep under varying temperature conditions. Increasing temperature increases total microfluidic-induced sleep for WT animals. Thermosensory-defective mutants show the same microfluidic-induced sleep phenotype as WT at 18 °C, but significantly less sleep at 22 and 25 °C, indicating that thermosensory input can act to drive or suppress microfluidic-induced sleep (from left to right on the plot the number of animals n = 37, 68, 71, 41, 67, and 60). d Total sleep under different confinement conditions. Micrographs show chamber geometries. When WT animals are confined in smaller chambers, they only show an increase in total microfluidic-induced sleep when slightly compressed in 50 μm-wide chambers. mec-10(tm1552) mutants show an identical phenotype to WT in 500 μm and 110 μm chambers, but dramatically reduced sleep compared with WT when compressed. These results suggest that nociceptive input to mechanosensory neurons regulates microfluidic-induced sleep (from left to right on the plot the number of animals n = 68, 64, 69, 66, 64, and 57). (ns = not significant, **p < 0.01, ***p < 0.001, ****p < 0.0001; Kruskal–Wallis with a post hoc Dunn–Sidak test). Source data is available as a Source Data file

