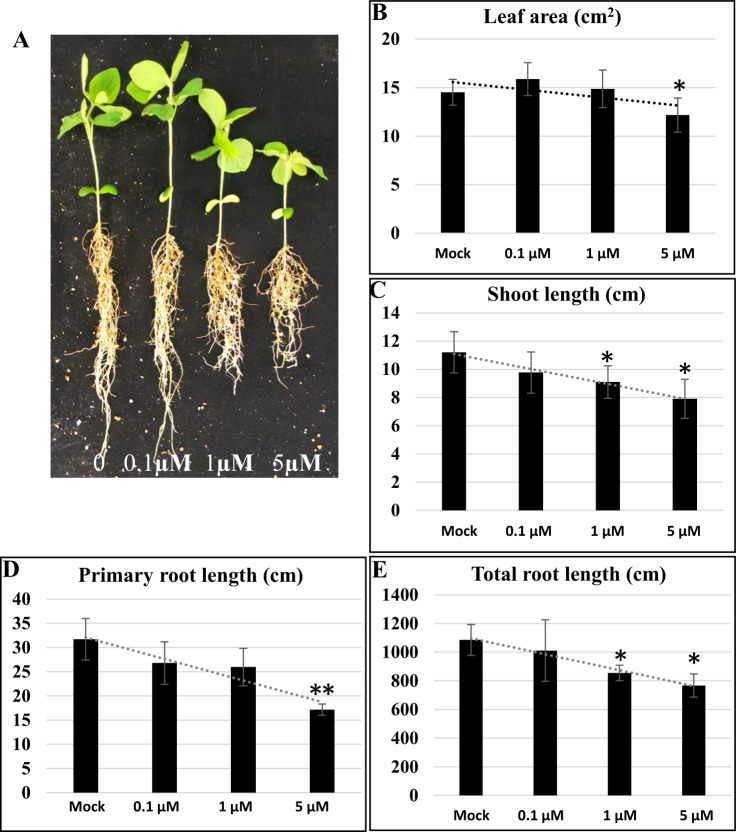
Figure 1.
Responses of soybean seedlings to treatments with different concentrations of the inhibitor Pcz. (A) Left to right: soybean (Williams 82 genotype) growing until the VE stage and then irrigated with water with different concentrations of Pcz for 10 days. (B–E) Leaf area, shoot length, primary root length and total root length were monitored under 0.1 µM, 1 µM or 5 µM Pcz treatment for 10 days after soybean growth reached the VE stage. (n ≥ 30). Statistical differences are marked with *(p ≤ 0.05) or **(p ≤ 0.01) based on Student’s t-test analysis.

