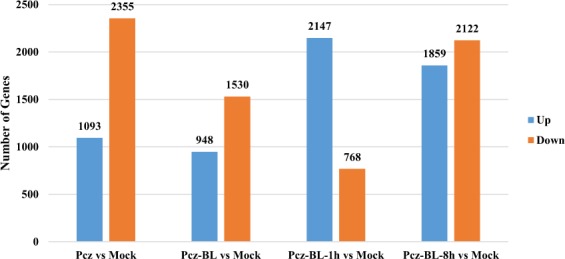
Figure 2.

Number of DEGs between mock and various treatments. Number of DEGs in Williams 82 soybean plants under the following conditions (Pcz vs Mock): 5 µM Pcz for 10 days, (Pcz-BL vs Mock): 5 µM Pcz with 10 nM BL for 10 days, (Pcz-BL-1h vs Mock): 5 µM Pcz for 10 days followed by 1 µM BL for 1 h, (Pcz-BL-8h vs Mock): 5 µM Pcz for 10 days followed by 1 µM BL for 8 h] (P value ≤ 5e-5, and genes with an expression ratio log2 ≥2 or ≤−2 were selected).
