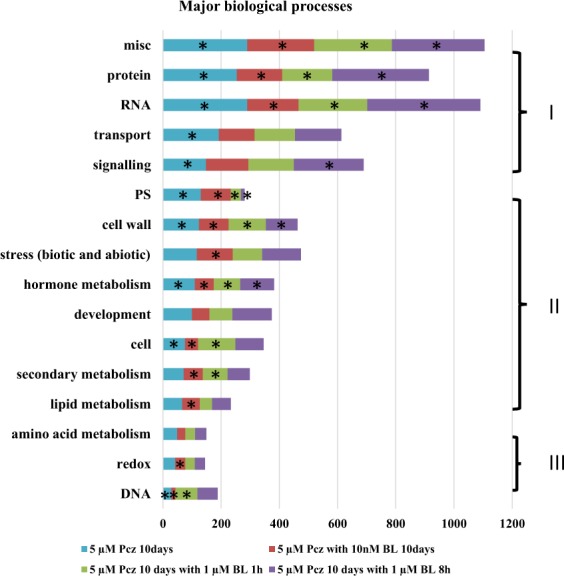
Figure 3.

GO term assignments in different categories of biological processes for DEGs by Mapman tool. The abscissa indicates the number of unigenes. The same color represents the same conditions. The graph illustrates the number of genes annotated with 16 different GO terms. Four groups (groups I, II, III and VI) were divided according to the number of genes in response to different conditions: group I > 600 genes, 200 genes < group II < 600 genes, and 100 genes < group III < 200 genes. The statistical significance of each process under all treatments was assessed by Fisher’s exact test. The overrepresented categories of biological processes (P values < 0.05) were labeled with an asterisk (*).
