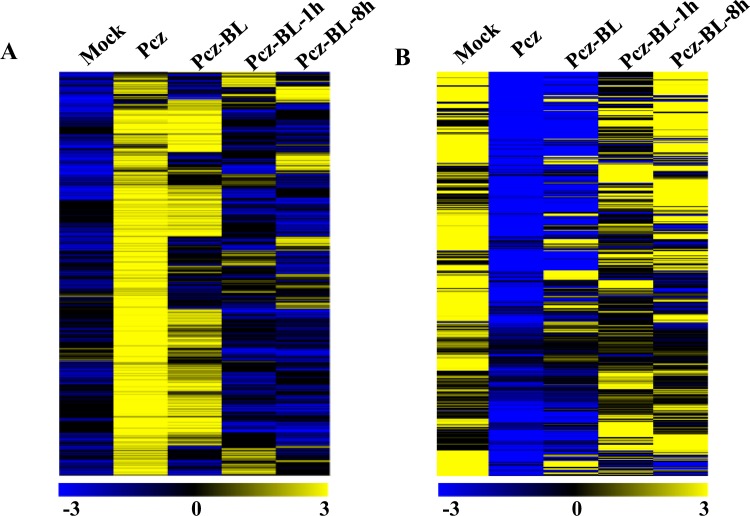
Figure 4.
Heat map representation of the FPKM expression of upregulated or downregulated DEGs in Pcz treatment under various BR concentrations. The color bar at the bottom shows the range of expression values, from increased expression (yellow) to decreased expression (blue).Genes were hierarchically clustered based on Euclidean distance of FPKM data and complete linkage. (A) Heat map for upregulated DEGs between Pcz treatment and mock (B) Heat map for downregulated DEGs between Pcz treatment and mock.

