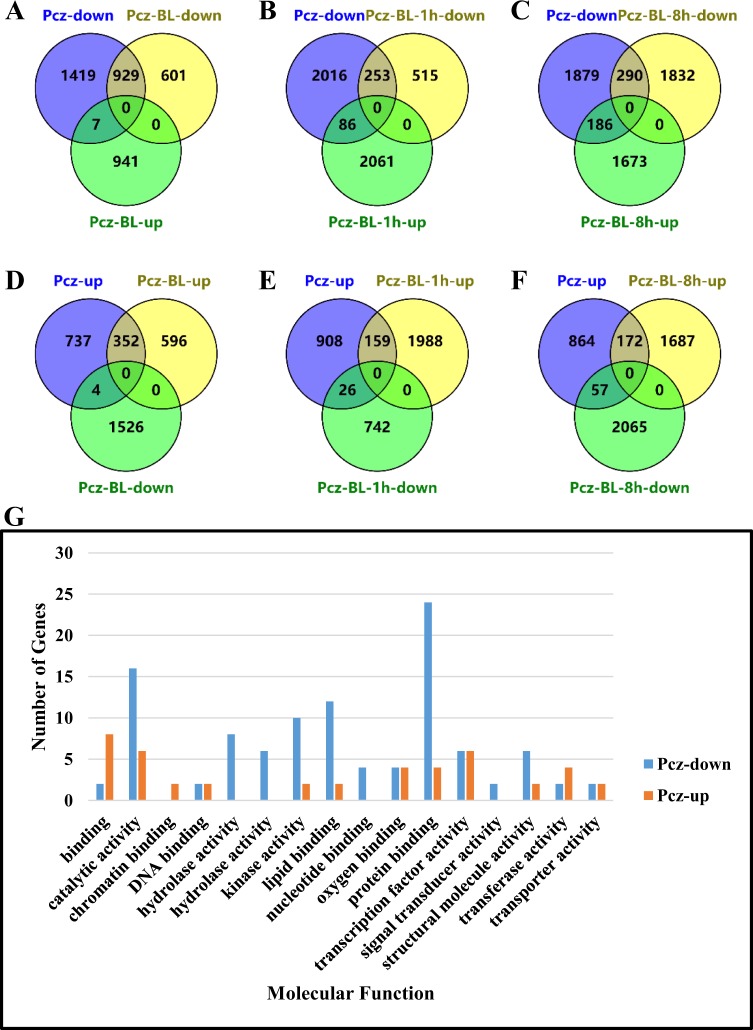
Figure 5.
Venn diagram and GO terms display the upregulated or downregulated overlapping DEGs between Pcz treatment and other treatments (Pcz-BL, Pcz-BL-1h and Pcz-BL-1h). (A–C) Venn diagram showing the overlapping DEGs between the downregulated genes under Pcz treatment and other treatments (Pcz-BL, Pcz-BL-1h or Pcz-BL-1h). (D–F) Venn diagram showing the overlapping DEGs between the upregulated genes under Pcz treatment and other treatments (Pcz-BL, Pcz-BL-1h or Pcz-BL-1h). (G) GO terms display the inversely regulated DEGs between Pcz treatment and other treatments (Pcz-BL, Pcz-BL-1h or Pcz-BL-1h) as molecular function. The absolute number reflects the amount of GO IDs that were connected to the molecular function.

