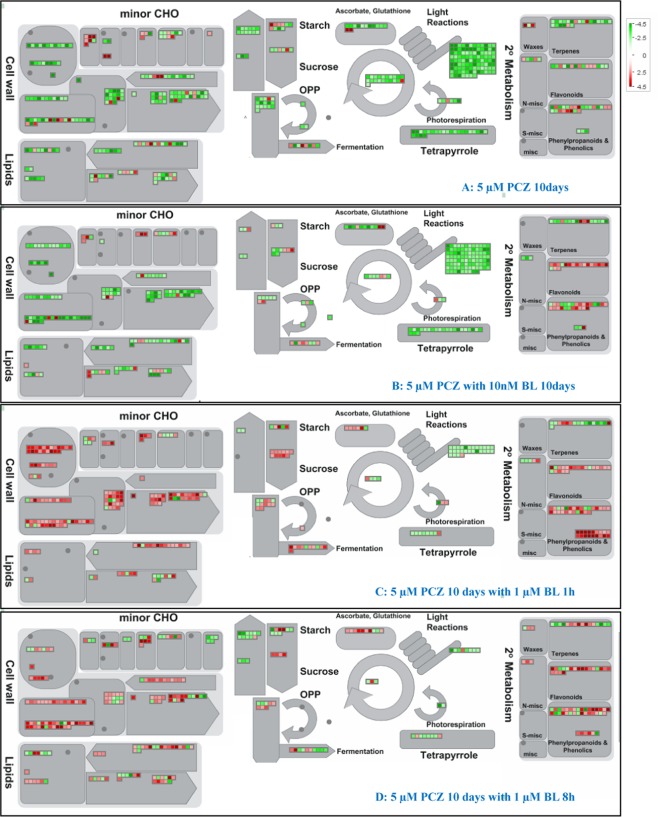
Figure 6.
MapMan overview of the metabolism- and cell wall-related genes among group I that were differentially expressed under the four different treatments. Metabolism-, PS-, and lipid-related genes were downregulated under Pcz or Pcz-BR treatment but upregulated after high concentrations of BL were applied for 1 h or 8 h compared with mock treatment. (A) 5 µM Pcz for 10 days, (B) 5 µM Pcz with 10 nM BL for 10 days, (C) 5 µM Pcz for 10 days with 1 µM BL for 1 h, (D) 5 µM Pcz for 10 days with 1 µM BL for 8 h. The log2-fold changes of significantly DEGs were imported and visualized in MapMan. Transcripts significantly up- and downregulated are indicated in red and green, respectively. The genes were assigned to their associated metabolic pathways. Each square corresponds to a gene. The green squares indicate genes suppressed in comparison to the mock. The red squares indicate genes induced in comparison to the mock. MapMan version 3.6.0 was used to generate the images from the gene expression data. The scale bar is shown in log2 from −4.5 to 4.5.

