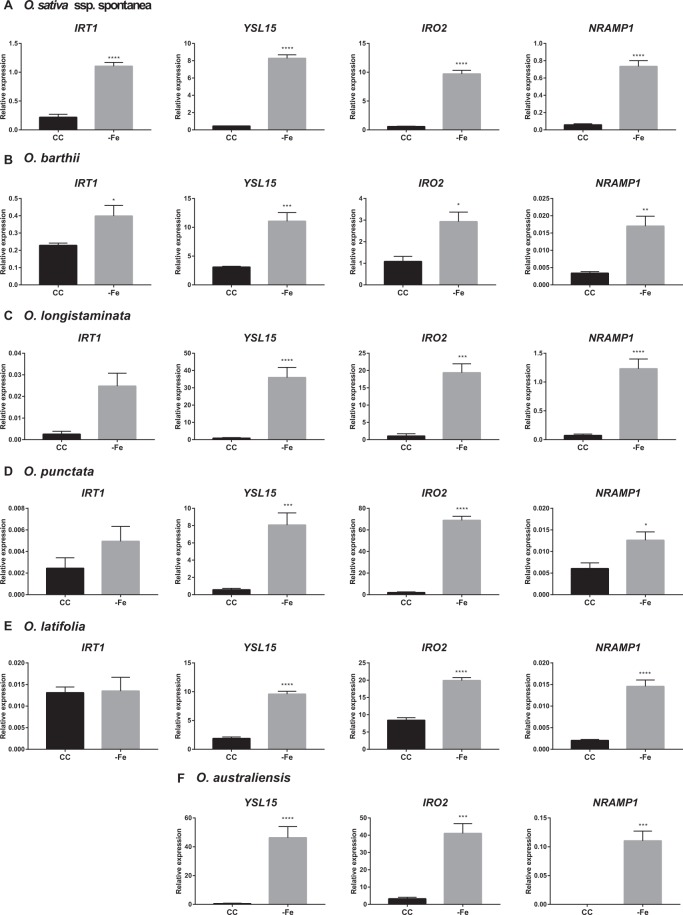
Figure 4.
Expression analysis of Fe deficiency-related genes in (A) Oryza sativa ssp. spontanea; (B) O. barthii; (C) O. longistaminata; (D) O. punctata; (E) O. latifolia; (F) O. australiensis. Relative expression levels (RT-qPCR, relative to OsUBQ5 expression) of selected genes (IRT1, YSL15, IRO2, and NRAMP1) in roots of plants submitted to control (CC) or Fe deficiency (−Fe) conditions for five days. Roots were collected from plants grown in non-aerated nutrient solution, at three-leaf stage on both conditions at the time of RNA extraction. Values are the averages of four samples (3 plants each) ± SE. Asterisks indicate statistical difference between plants grown under CC and −Fe conditions (Student t-test, *P-value < 0.05, **P-value < 0.01, ***P-value < 0.001, ****P-value < 0.0001).

