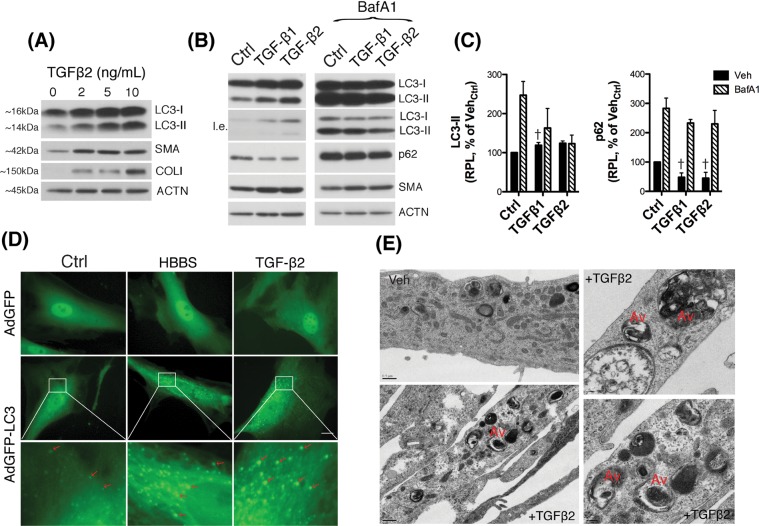
Figure 6.
TGFβ treatment dysregulates autophagy in TM cells. (A) Human TM cells were treated with increasing concentrations of TGFβ2 (0, 2, 5, 10 ng/mL) for 48 h. Levels of LC3, SMA and Col I were evaluated in whole cell lysates (5 μg) by western blot. (B) Protein levels of LC3, p62 and SMA evaluated by western blot in TM cells treated with TGFβ1 or TGFβ2 (10 ng/mL) for 48 h in the absence or presence of BafA1 (100 nM) added to the culture media 24 h post-TGFβ treatment. (C) Relative quantification of p62 and LC3-II levels calculated from densitometric analysis of the bands, expressed as percentage of VehCtrl. Control and BafA1-treated samples derive from the same experiment and gels/blots were processed in parallel. β-actin was used as loading control. (D) TM cells transduced with either AdGFP or AdGFP-LC3 (5 pfu/cell) were treated with TGFβ2 (10 ng/mL). The presence of GFP-LC3 puncta (red arrows) was evaluated at 48 h using the CELENA® S Digital Imaging System. TM cells undergoing starvation by culturing in HBSS media were used as autophagy control. (E) Electron micrographs of TM cells treated with TGFβ2 (10 ng/mL) for 48 h showing the presence of autophagic vacuoles (Av). †Denotes statistical significance using one-way ANOVA with multiple comparisons. Specific mean ± SD and p values, as well as densitometric analysis of SMA are included in Supplemental Material. RPL: Relative protein levels; l.e.: lower exposure.

