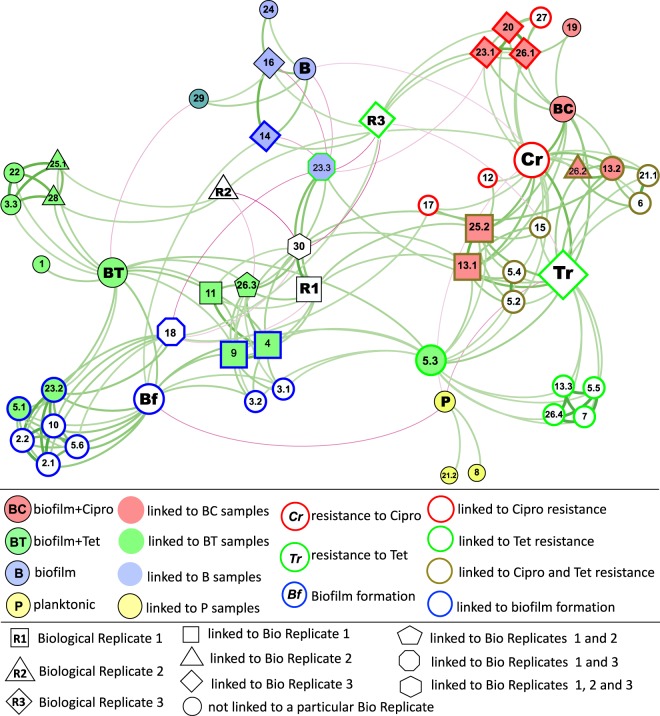
Fig. 3.
The network linking mutations with the growth regime, phenotypes, and biological replicates. The force-directed representation of the network is constructed based on co-occurrence patterns and correlations (p value <0.01) between mutations and the growth regime, between mutations and phenotypic measures, and between mutations and biological replicates. Growth regime/sample types are presented as color-filled nodes: P—planktonic culture (yellow-filled), B—antibiotic-free biofilm effluent (blue-filled), BC—ciprofloxacin-exposed biofilm effluent (red-filled), BT—tetracycline-exposed biofilm effluent (green-filled). Phenotypes are presented as color-outlined nodes: Bf (blue-outlined)—biofilm formation, measured in microtiter plate assay; Cr (red-outlined)—resistance to ciprofloxacin measured in MIC assay; and Tr (green-outlined)—resistance to tetracycline measured in MIC assay. P, B, BT, and BC nodes represent the sample type; Bf, Cr, and Tr nodes represent a phenotype; R1, R2, and R3 represent biological replicates 1, 2, and 3, respectively; all other nodes denote mutations directly linked with a specific sample type and/or phenotype. The fill color of nodes corresponds to the sample type that the mutation directly correlates with (linked to P—yellow-filled, to B—blue-filled, to BC—red-filled, to BT—green-filled). The node outline color corresponds to the phenotype with which the mutation is directly linked to (linked to Bf—blue-outlined, to Cr—red-outlined, to Tr –green-outlined). Mutations directly linked to both ciprofloxacin and tetracycline resistance are outlined in khaki. Mutations linked to a particular biological replicate are indicated as squares (linked to replicate 1), triangles (linked to replicate 2), diamonds (linked to replicate 3), pentagons (linked to replicates 1 and 2), octagons (linked to replicates 1 and 3), and a hexagon (linked to replicates 1, 2, and 3). The size of the node is relative to the node authority. Edges (the lines connecting the nodes) represent correlations between two nodes, positive correlations are presented in green, and negatives in magenta. Edge thickness/intensity represents the strength of correlation. The full description of each mutation is presented in Table 2

