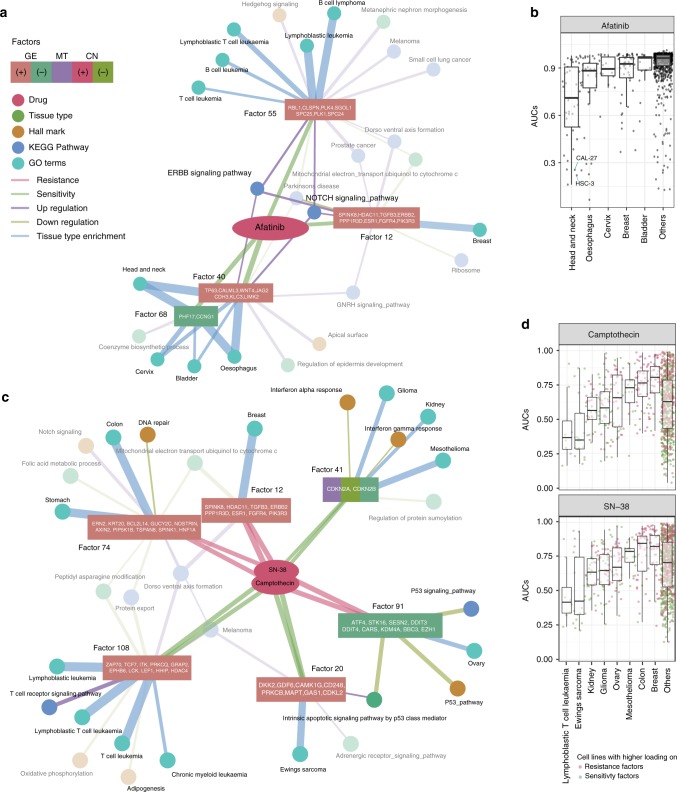
Fig. 4.
Network-based combined interpretation of factors that explain drug responses. a Top factors (square nodes) explaining the response to Afatinib (BIBW2992; pink node) with their associated tissue types (green nodes) and functions (dark yellow, blue and blue-green nodes) in a network. Listed in the corresponding node are the top genes from each factor indicating the factor. The types of node and edges are denoted by colors indicated in the figure. The nodes mentioned in the text are highlighted. b Afatinib response of cell lines by tissue types highlighted in a. Two sensitive head and neck cancer cell lines (CAL-27 and HSC-3) are indicated. Standard notations are used for elements of the boxplot (i.e. upper/lower hinges: 75th/25th percentiles; inner-segment: median; and upper/lower whiskers: extension of the hinges to the largest/smallest value at most 1.5 times of interquartile range). c Top factors that explain the response to TOP1 inhibitors, SN-38 (Irinothecan) and Camptothecin represented in a network (format as in a). d Camptothecin (top panel) and SN-38 (Irinotecan; bottom panel) response of cell lines by tissue types highlighted in c. Color of nodes indicates higher loading in sensitive factors (green) and resistance factors (red) for each cell line. Standard notations are used for elements of the boxplots

