
Figure 8.
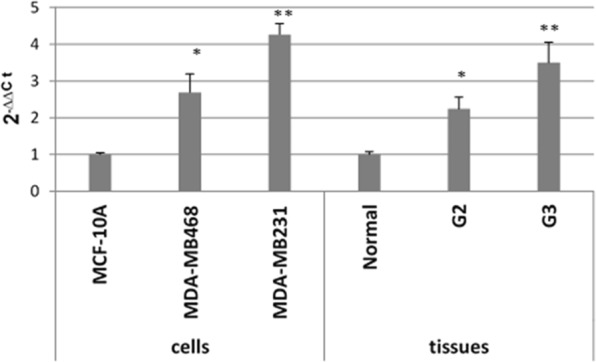
SEPHS2 levels in MDA-MB468 and MDA-MB231 cells compared to MCF10A cells and in TNBC tissues compared to their normal counterparts based on RT-qPCR analysis. The p-values <0.05 and <0.01 are indicated by * and **, respectively.
Official websites use .gov
A
.gov website belongs to an official
government organization in the United States.
Secure .gov websites use HTTPS
A lock (
) or https:// means you've safely
connected to the .gov website. Share sensitive
information only on official, secure websites.
SEPHS2 levels in MDA-MB468 and MDA-MB231 cells compared to MCF10A cells and in TNBC tissues compared to their normal counterparts based on RT-qPCR analysis. The p-values <0.05 and <0.01 are indicated by * and **, respectively.