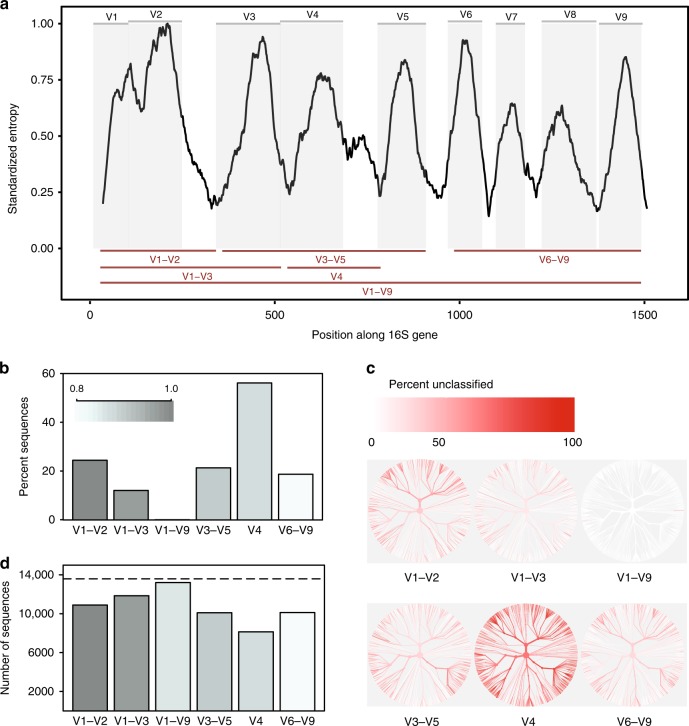
Fig. 1.
In-silico comparison of 16S rRNA variable regions. a Shannon entropy across the 16S gene based on the alignment of a single representative sequence for each known species present in the Greengenes database. Sequences were aligned against a single reference 16S gene for Escherichia coli K-12 MG1655 (NCBI Gene ID 947777). Gray panels depict variable regions defined by commonly used primer-binding sites (Supplementary Table 1). Variable regions considered in this study are shown as red lines (bottom). b Proportion of sequences for each variable region that could not be identified to species level when classifying each sequence against the reference database from which it was derived at a confidence threshold of 80% (RDP classifier). c Trees based on taxonomy of sequences present in the in-silico database. The same tree is provided for each variable region. The color of each branch reflects the proportion of sequences within each clade that could not be identified to species level. d The number of OTUs created when clustering sequences for each variable region at 99% sequence similarity. Dashed line indicates the number of unique sequences (>1% different) in the original database. Source data are provided as a Source Data file

