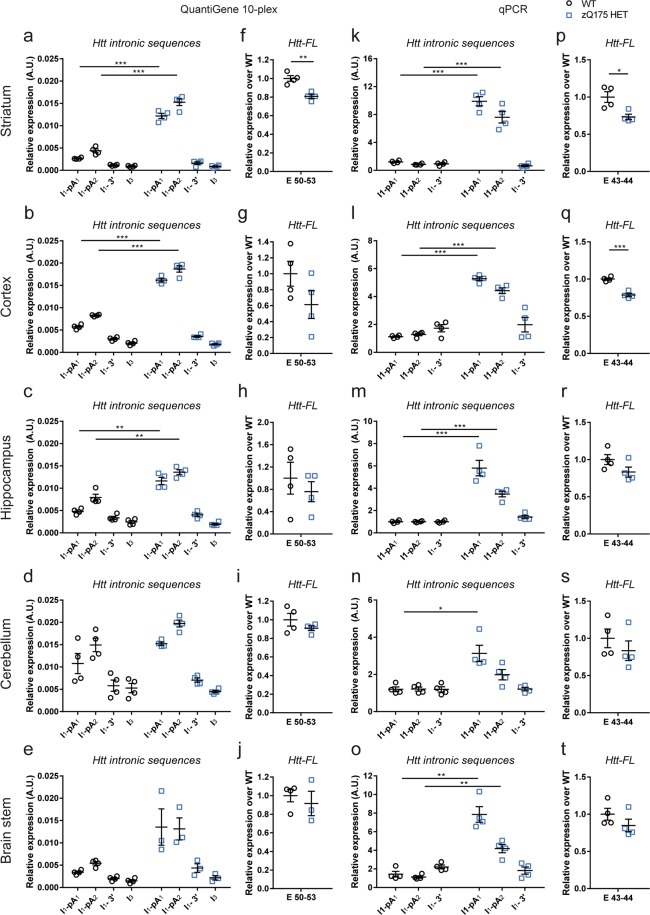
Figure 3.
Comparison of the analysis of Htt transcripts in the striatum of zQ175 heterozygous animals using the 10-plex QuantiGene panel and qPCR assays. Expression of the Htt intronic sequences and Htt-FL transcripts was measured by our QuantiGene 10-plex assay (a–j) and qPCR (k-t) in striatum, cortex, hippocampus, cerebellum and brain stem of 2 month old mice, and presented relative to that for housekeeping genes. (a–e and k–o) Httexon1 transcripts can be detected in all brain regions by both approaches. (f–j and p–t) The levels of Htt-FL as measured by both approaches were comparable. Data were obtained from n = 4/genotype with two technical replicates for QuantiGene and three for qPCRs. Statistical analysis was by multiple t-test with Benjamini-Hochberg with an alpha of 0.05; *p < 0.05, **p < 0.01, ***p < 0.001. Tissue lysate dilutions were 1:3 for striatum and brain stem, 1:4 for cortex and cerebellum and 1:5 for hippocampus.

