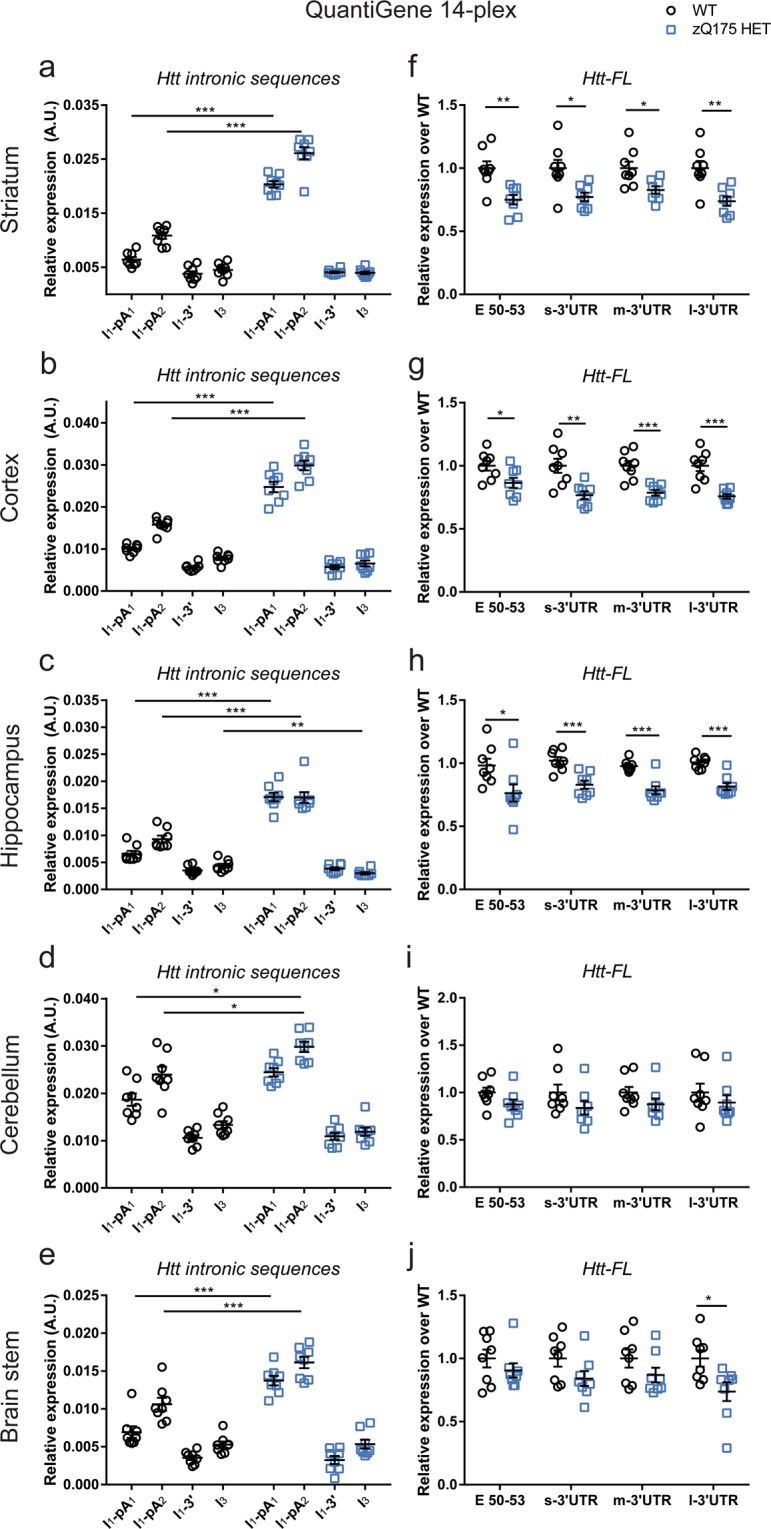
Figure 4.

Expression analysis of Htt transcripts in five brain regions using the custom-made 14-plex QuantiGene assay. The expression of intronic Htt transcripts in 2 month old mice are presented relative to that for housekeeping genes. (a–e) The Httexon1 transcript is present in all zQ175 brain regions. (f–j) The level of the Htt-FL transcript is significantly decreased in the striatum, cortex and hippocampus as measured by the E50-53 and all 3′UTR probe sets. Data were from n = 4/genotype with two technical replicates. Statistical analysis was by multiple t-test with Benjamini-Hochberg with an alpha of 0.05, *p < 0.05, **p < 0.01, ***p < 0.001. Tissue lysate dilutions were 1:3 for striatum, hippocampus and brain stem, 1:4 for cortex and cerebellum.
