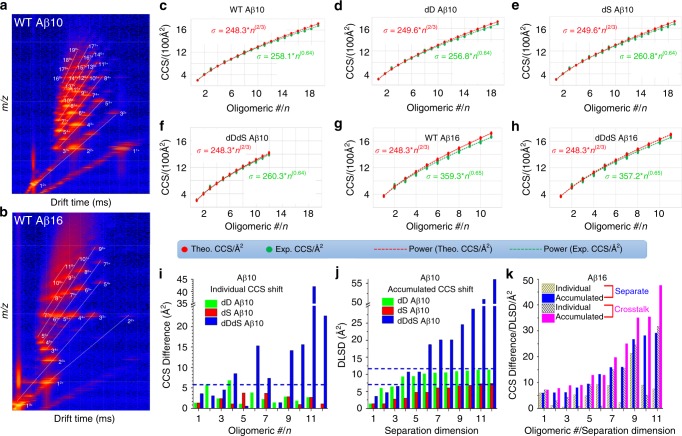
Fig. 4.
iCAP for distinguishing chiral Aβ fragment oligomers. a, b Representative Driftscope maps for WT Aβ (1–10) and Aβ (1–16). c–h Growth curves for various Aβ fragments. For comparison, both isotropic growth-based prediction and IM-MS measurement-based experimental results have been shown. i CCS differences as a function of oligomeric number of Aβ (1–10) as calculated simply by deduction of CCS values from individual WT Aβ oligomers. j DLSD values as a function of separation dimension for accumulated Aβ (1–10) oligomers as calculated by accumulating the CCS differences in (i) using functions in Fig. 1. k Individual CCS differences (yellow and gray bars that are made of oblique lines) as a function of oligomeric number of Aβ (1–16) and accumulated DLSD values (blue and magenta bars) as a function of separation dimension for separate (WT and dDdS peptides were separately analyzed) and crosstalked (mixing WT and dDdS peptides) Aβ (1–16) oligomers. Aβ (1–10) and Aβ (1–16), 600 µM. Buffer, 10 mM NH4OAc. Crosstalking experiments, final concentrations of individual WT Aβ (1–16) and dDdS Aβ (1–16), 300 µM. Source data are provided as a Source Data file

