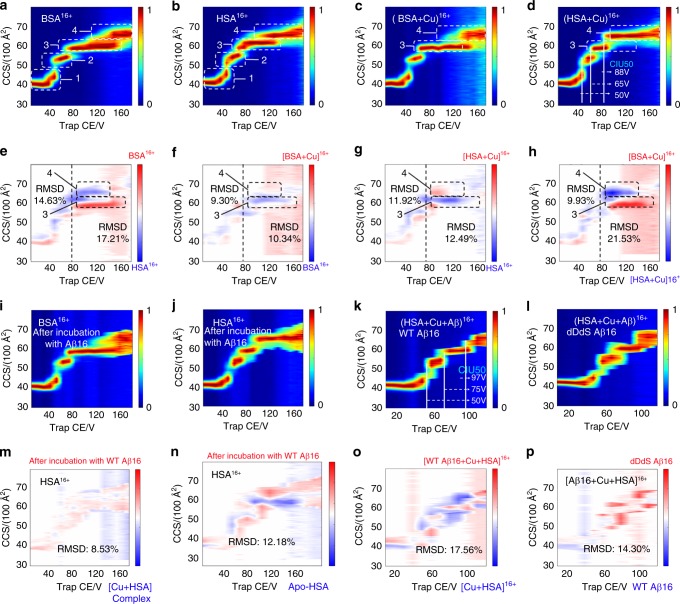
Fig. 5.
iCAP for distinguishing chiral Aβ (1–16) recognition of receptors. CIU fingerprints: 16 + apo-serum albumin (a, b), metal-bound serum albumin (c, d), remaining serum albumin after incubation with Aβ (1–16) and Cu (i, j), and triple HSA-Aβ-Cu complex (k, l). CIU difference plots: between BSA and HSA (e/h), between BSA-Cu complex and BSA (f), between HSA-Cu complex and HSA (g). The structural changes induced by Aβ (1–16) binding were indicated by CIU50 (d/k) and CIU difference plots of HSA (m/n) and HSA-Cu complex (o). The differences between WT and dDdS Aβ (1–16) were presented by CIU difference plots of HSA-Aβ-Cu complex (p). Four major conformer families (1−4, highlighted in a–d) are detected. Buffer, 100 mM NH4OAc. Concentrations: Aβ (1–16), 15 µM; Cu2+, 20 µM; BSA/HSA, 7.5 µM. Source data are provided as a Source Data file

