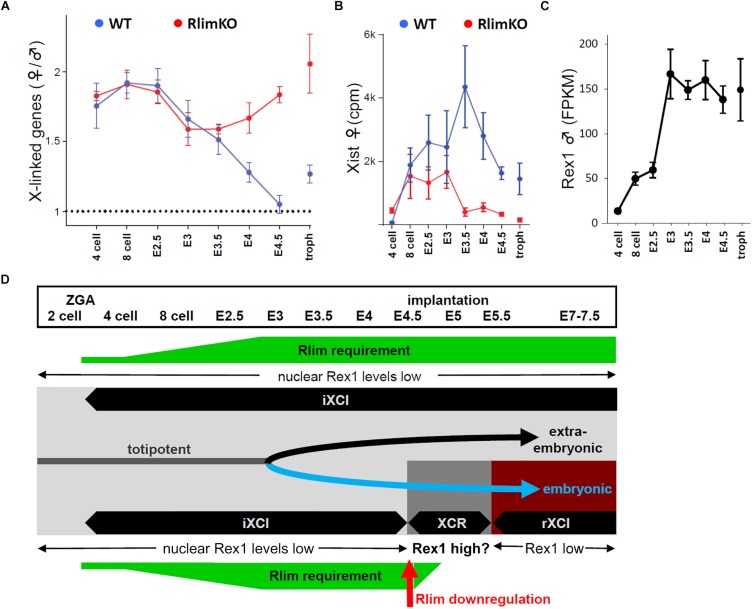
FIGURE 2.
(A–C) Comparisons of gene expression profiles during preimplantation development as elucidated by single embryo RNA-seq. All data shown originate from the same dataset (RlimKO; Wang et al., 2017). Shown are comparisons of total X-linked gene expression in female RlimKO and WT embryos, normalized to males (A), Xist RNA expression in RlimKO and WT females (B), and Rex1 expression in males (C). Note that once Rex1 reaches high levels at embryonic stage E3, Xist levels in RlimKO females drop dramatically at E3.5 halting/reversing the process of X dosage compensation. (D) Summary of XCI during female mouse embryogenesis. The requirement of Rlim (green) and its effect on nuclear Rex 1 protein levels are shown. Embryonic stages, iXCI, rXCI and XCR as well as cell lineages are indicated (gray, totipotent cell lineage; black, extraembryonic cell lineages; blue, embryonic/epiblast cell lineage).

