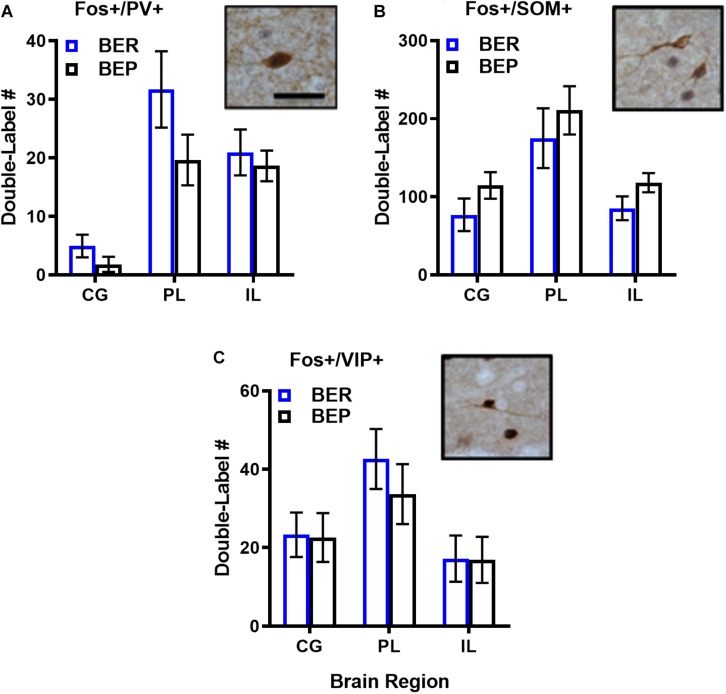
FIGURE 3.
Total numbers of PF-activated inhibitory neurons in the mPFC of BEPs and BERs. Values for PV+ (A), SOM+ (B), and VIP+ (C) inhibitory neurons represent ANCOVA-adjusted means, using PF consumed prior to sacrifice as the covariate; error bars represent 1 SEM. Representative images of double-labeled inhibitory neurons are also presented in (A–C); scale bar represents 50 pm.

