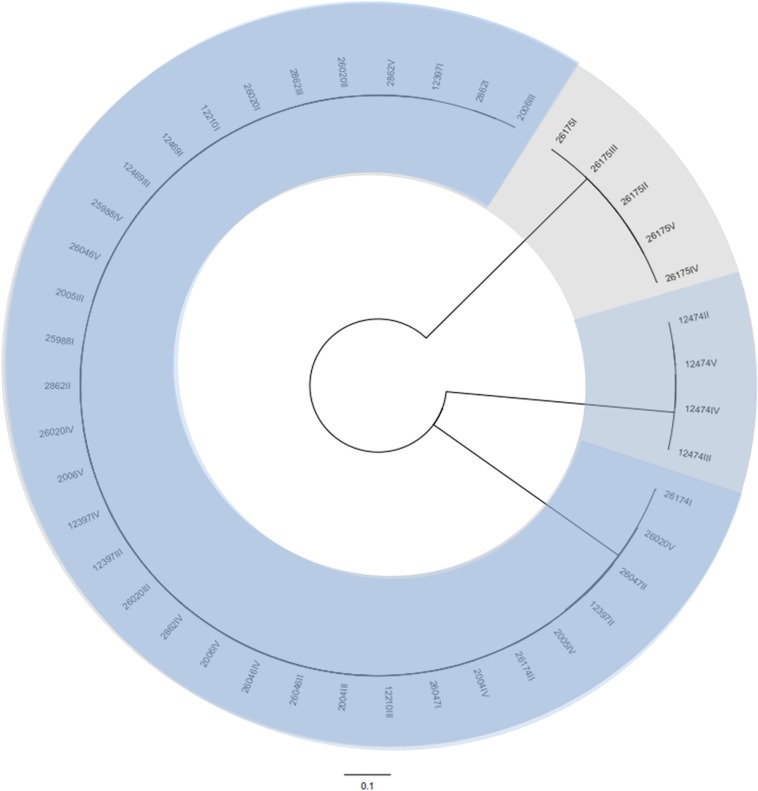
FIGURE 1.
Phylogenetic tree of the 43 bacteriophages isolated during this study using VICTOR (Supplementary Data S1). The scale represents homology % and yields an average support of 33%. The number of clusters determined were three, representing the genetic groups here described – Peduovirus (mild blue), Tequintavirus (gray) and Tunavirinae (blue).

