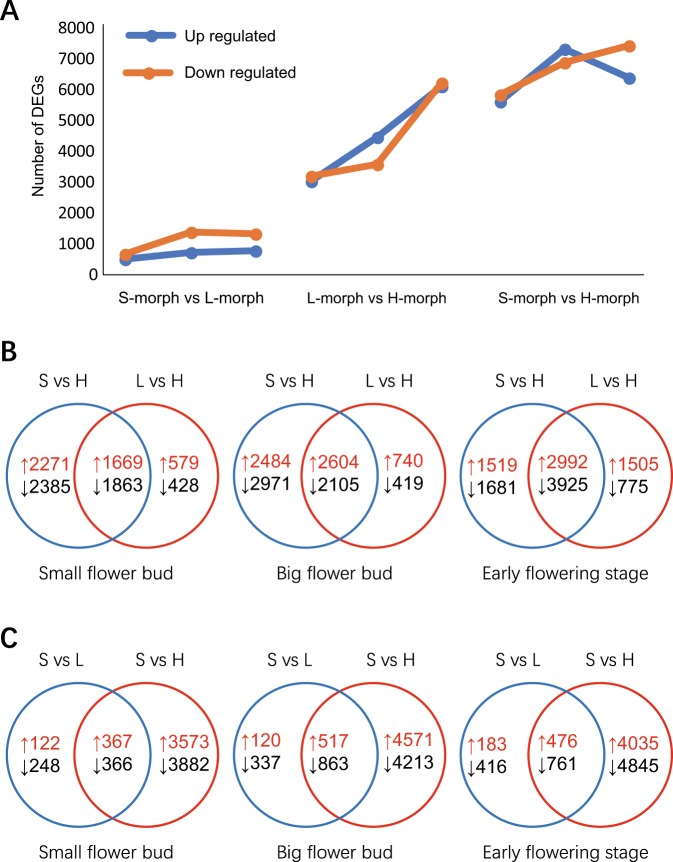
Fig. 3.
Differential gene expression and comparative analysis of DEGs in styles at three developmental stages among three morphs. a Number of DEGs at different developmental stages in pairwise comparisons among three morphs. b Venn diagrams show common or unique DEGs at different developmental stages in H-morph vs. S-morph and H-morph vs L-morph. c Venn diagrams show common (core DEGs) or unique DEGs at different developmental stages in S-morph vs. L-morph and S-morph vs H-morph. Red arrows indicate upregulated genes and black arrows indicate downregulated genes

