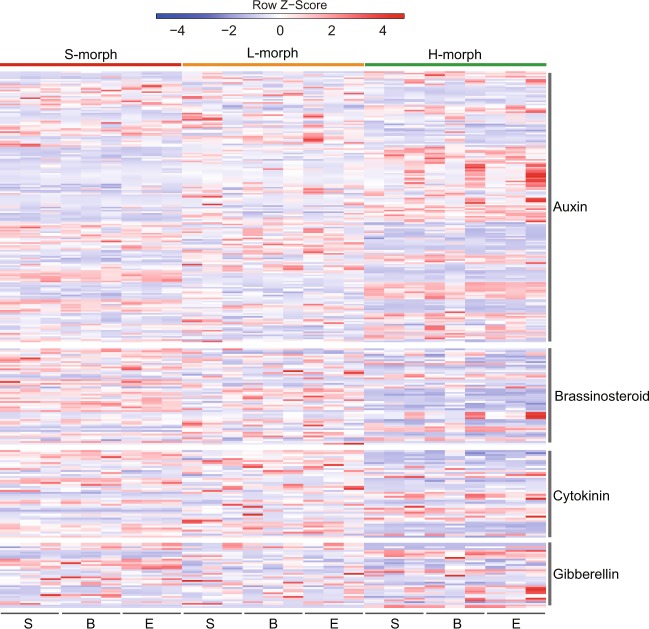
Fig. 4.
Heat map of DEGs related to the phytohormone metabolism. Within each row the expression data (FPKM) are normalized using Z score scaling. The blue bands indicate low gene expression and the red bands indicate high gene expression. Cluster analysis of DEGs within each phytohormone module is based on hierarchical clustering. S: small floral bud; B: big floral bud; E: early flowering stage

