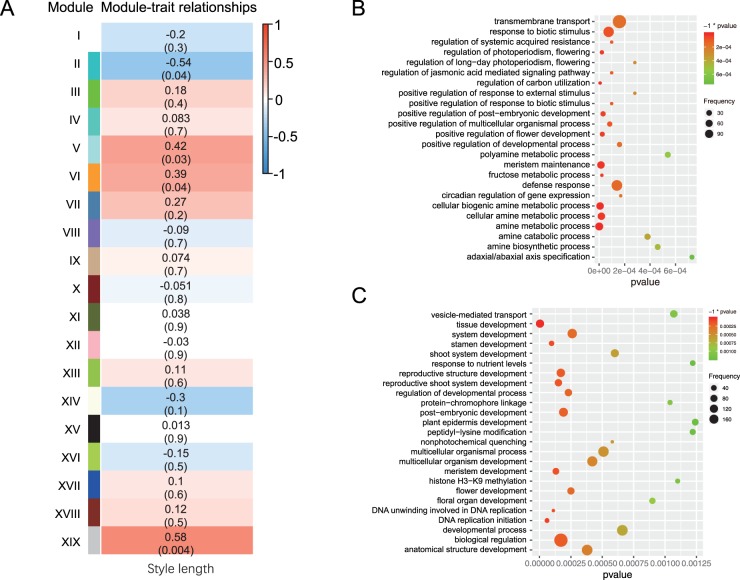
Fig. 5.
Module-trait relationships and GO enrichment analysis of modules significantly correlated with the style length. a Relationships between style length and co-expressed gene modules. Each row corresponds to a module eigengene (correlation between a trait and a module). Each cell contains the corresponding correlation and p value. b GO (BP) enrichment analysis of module II that negatively correlated with the style length. c GO (BP) enrichment analysis of module XIX that positively correlated with the style length

