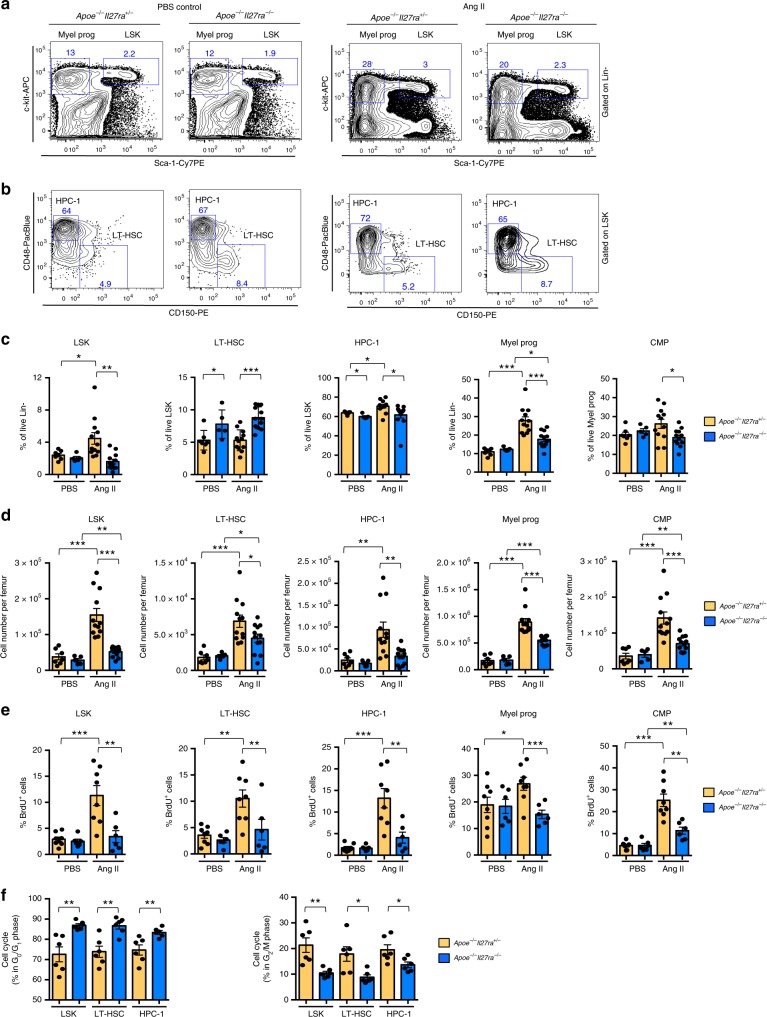
Fig. 3.
IL-27R deficiency leads to limited expansion of HSCs in response to Ang II. BM was obtained from Apoe−/−Il27ra+/− (n = 7) and Apoe−/−Il27ra−/− (n = 5), or Apoe−/−Il27ra+/− (n = 12) and Apoe−/−Il27ra−/− (n = 12) mice fed with WD for overall period of 12 weeks and infused with PBS or Ang II for last 4 weeks of feeding, respectively. a Representative dot plots of live LSK (Lin−Sca-1+c-kit+) and myeloid progenitors (Lin−Sca-1−c-kit+). b Representative dot plots of live LT-HSC (Lin−Sca-1+c-kit+CD150+CD48−) and HPC-1 (Lin−Sca-1+c-kit+CD48+CD150−) cells. c Average percentage of live LSK, LT-HSC, HPC-1, myeloid progenitors, and CMP (Lin−Sca-1−c-kit+CD16/CD32−CD34+). d Absolute number of live LSK, LT-HSC, HPC-1, myeloid progenitors, and CMP. e Proliferation of HSPCs from Apoe−/−Il27ra+/− (n = 8) or Apoe−/−Il27ra−/− (n = 6) mice fed with WD and infused with Ang II or PBS as determined by BrdU incorporation. Percentage of live BrdU-positive LSK and myeloid progenitors, including LT-HSC, HPC-1, and CMP. Data are mean ± SEM from two independent experiments. f Percentage of progenitor cells from Apoe−/−Il27ra+/− (n = 6) or Apoe−/−Il27ra−/− (n = 6) mice infused with Ang II in G0/G1 and G2/M phase of cell cycle, analyzed for BrdU inclusion, and DAPI staining. Data are mean ± SEM from three independent experiments. *p < 0.05, **p < 0.01, ***p < 0.005, unpaired Student’s t-test (two-tailed)

