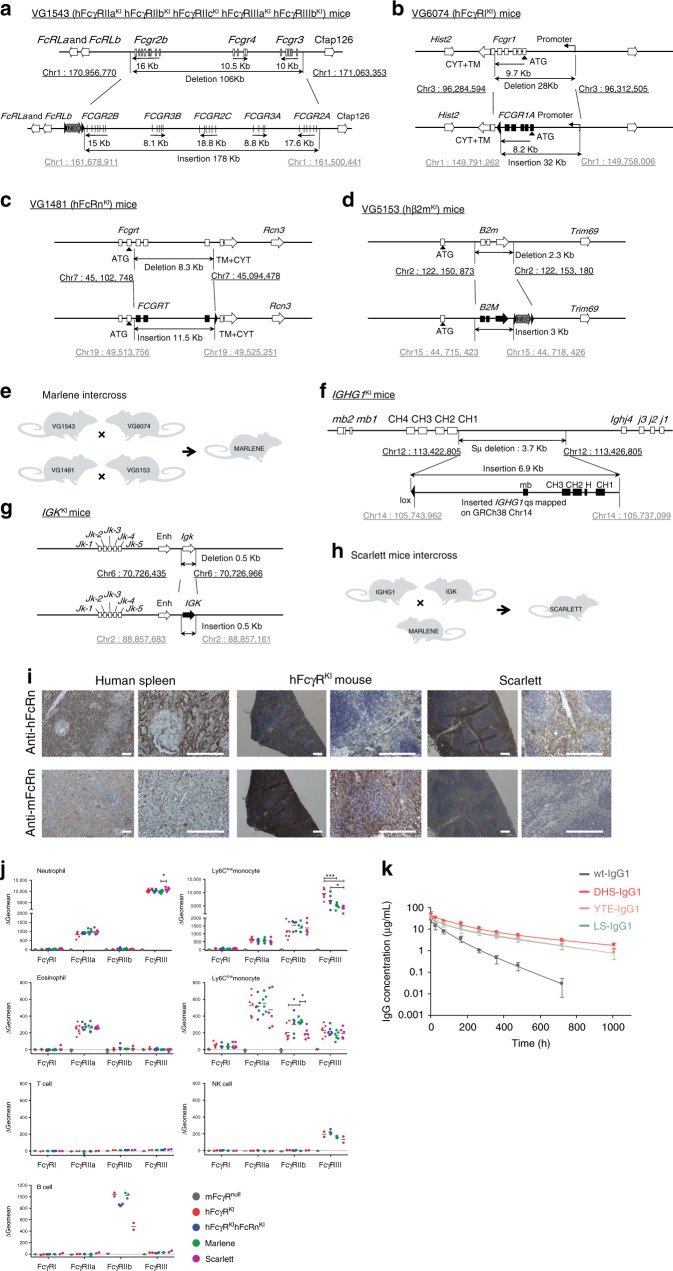
Fig. 2.
IgG pharmacokinetics in new knock-in mouse models. a–h Generation of knock-in mice for human FcγRs, FcRn, β2m, IgG1 heavy chain and kappa light chain constant regions: a humanization of the mouse low-affinity receptor locus; b humanization of the ectodomains of mouse FcγRI; c humanization of the ectodomains of mouse FcRn; d humanization of the mouse β2m gene (B2m); e breeding strategy to generate Marlene mice; f replacement of the switch μ region of the mouse heavy chain locus by the constant region of human IgG1 heavy chain (IGHG1); g humanization of the kappa light chain gene (IGK); h breeding strategy to generate Scarlett mice; a–d, f–g representations are not drawn to scale. Coordinates are based on mouse (GRCm38.p4) and human (GRCh38.p7) genomic assemblies; mouse genes are in empty rectangles, genomic coordinates are in black; human genes are in solid rectangles, genomic coordinates are in gray, black triangles represent LoxP sites. mb, exon encoding the transmembrane and intracytoplasmic domains; H, exon encoding the hinge domain; Neo, selection cassette. Mouse silhouette was created by co-author P.B. i Immunohistochemical localization of hFcRn or mFcRn in tissue sections of human spleen, and spleen sections from of hFcγRKI mice (VG1543 × VG6074) and Scarlett mice. Scale bar = 200 μm. j hFcγR expression on different cell populations from the spleen of FcγRnull (negative control), hFcγRKI (positive control), hFcRnKI hFcγRKI, Marlene and Scarlett mice. P values by one-way Anova with Tukey’s multiple comparison tests, *P ≤ 0.05 and ***P ≤ 0.001. k Change in serum IgG concentration following tail vein administration of 2 mg/kg of antibody in Scarlett (hFcRnKI hβ2mKI hFcγRKI hIgG1, κKI) mice (n = 6). Data are presented as mean ± standard deviation

