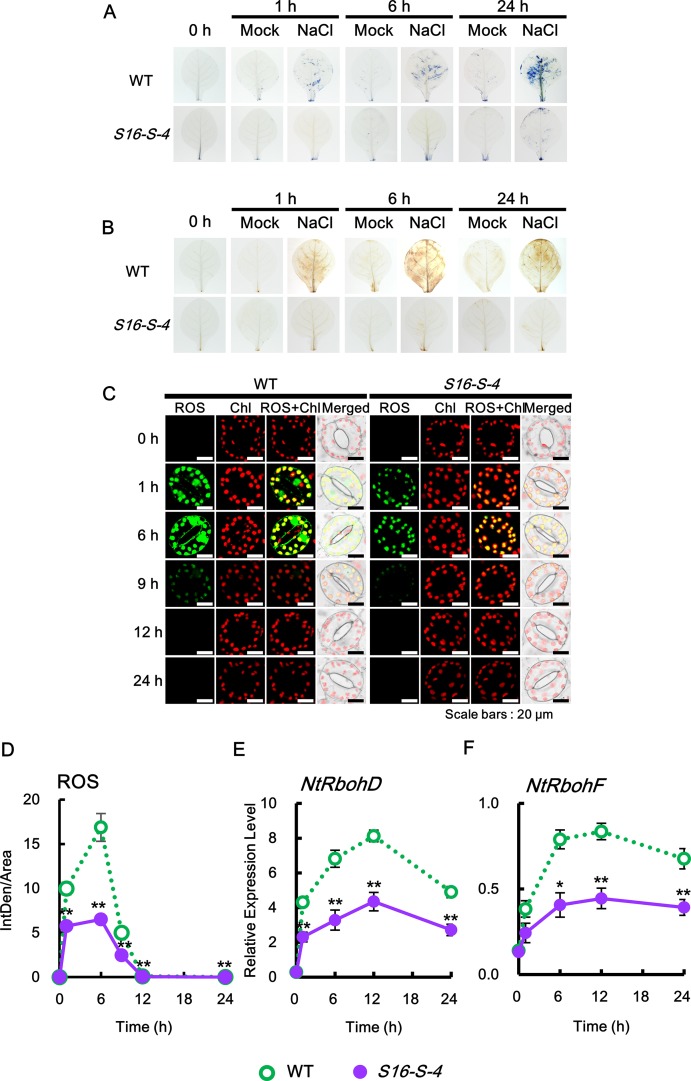
Figure 3.
Kinetics of ROS production in response to salt stress. (A) Superoxide radical (sporadic accumulation in leaves was detected after NBT staining in WT and transgenic plants with or without 200 mM NaCl. (B) Sporadic accumulation of H2O2 was determined by 3,3′-diaminobenzidine (DAB) staining in leaves from WT and transgenic plants after administering 200 mM NaCl. (C, D) Histochemical analysis of cellular reactive oxygen species (ROS) accumulation in response to salt stress. ROS accumulation was determined by incubation with 2′,7′-dichlorodihydrofluorescein diacetate (DCFH-DA) for 10 min. Staining images of leaves were obtained by confocal microscopy (C) and quantified by ImageJ software (D). (E, F) Relative mRNA levels of NtRbohD and NtRbohF genes after salt stress. Transcription levels of NtRbohD or NtRbohF are expressed as means ± SD. Transcription levels are expressed relative to the reference gene β-actin after qPCR. The photographs represented (A–C) are from one representative experiment after verifying the reproducibility of the results in three independent experiments with three leaves. Data were generated from one representative experiment with ten guard cells (D) and three independent biological replicates (E, F). An asterisk indicates a significant difference between WT and transgenic plants (*P < 0.05; **P < 0.01).

