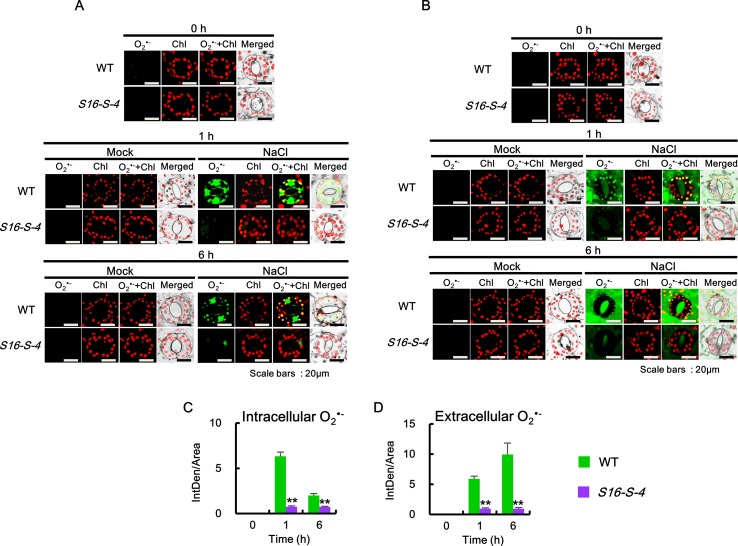
Figure 4.
Accumulation of intracellular and extracellular after salt stress in WT and transgenic plants (S16-S-4) leaves. (A) Intracellular superoxide was determined using confocal scanning microscopy following incubation with BES-So-Am. Images of the stained with BES-So-Am (green) and chlorophyll autofluorescence (red). (B) Extracellular superoxide was determined using confocal scanning microscopy by incubation with BES-So. Images of the stained with BES-So (green) and chlorophyll autofluorescence (red). (C, D) Green fluorescence signals for intracellular (C) and extracellular (D) were quantified by ImageJ. The photographs represented (A, B) are from one representative experiment with three leaves after verifying the reproducibility of the results in three experiments. Data (C, D) were generated from 10 cells in one representative experiment after verifying the reproducibility of the results in three experiments. An asterisk indicates a significant difference between WT and transgenic plants (**P < 0.01).

