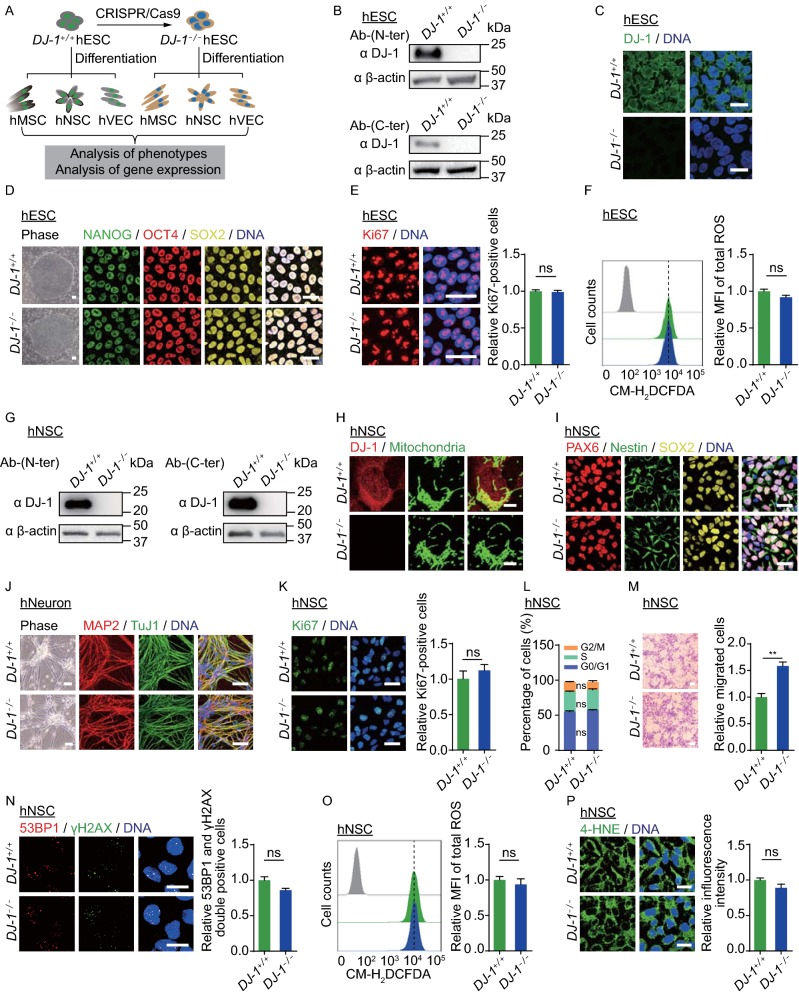
Figure 1.
DJ-1 deficiency exhibited a minimal impact on hESCs and hNSCs. (A) Schematic diagram of the generation of DJ-1−/− hESCs, as well as the generation of hMSCs, hNSCs and hVECs. (B) Western blotting analysis of DJ-1 expression in hESCs using anti-DJ-1 antibodies (N-terminus and C-terminus). β-actin was used as the loading control. (C) Immunofluorescence analysis of DJ-1 expression in WT and DJ-1−/− hESCs. Scale bar, 25 µm. (D) Phase-contrast images of hESCs are shown to the left. Scale bar, 50 µm. Immunofluorescence staining of the pluripotency markers is shown to the right. Scale bar, 25 µm. (E) Immunofluorescence analysis of Ki67 expression in WT and DJ-1−/− hESCs. Scale bar, 25 µm. Data are presented as the mean ± SEM, n = 3. ns, not significant. (F) Flow cytometry analysis of total ROS levels in WT and DJ-1−/− hESCs. Data are presented as the mean ± SEM, n = 3. ns, not significant. MFI, median fluorescence intensity. (G) Western blotting analysis of DJ-1 expression in hNSCs using anti-DJ-1 antibodies (N-terminus and C-terminus). β-actin was used as the loading control. (H) Immunofluorescence analysis of DJ-1 expression in WT and DJ-1−/− hNSCs. Scale bar, 7.5 µm. (I) Immunofluorescence analysis of hNSC markers in WT and DJ-1−/− hNSCs. Scale bar, 25 µm. (J) Phase-contrast images of hNeurons to the left. Scale bar, 50 µm. Immunofluorescence staining of hNeuron-specific markers in WT and DJ-1−/− hNeurons to the right. Scale bar, 25 µm. (K) Immunofluorescence analysis of Ki67 expression in WT and DJ-1−/− hNSCs. Scale bar, 25 µm. Data are presented as the mean ± SEM, n = 3. ns, not significant. (L) Cell cycle analysis of WT and DJ-1−/− hNSCs. Data are presented as the mean ± SEM, n = 3. ns, not significant. (M) Migration abilities of WT and DJ-1−/− hNSCs were evaluated by Transwell assay. Data are shown as the mean ± SEM, n = 3. Scale bar, 50 µm. ** P < 0.01. (N) Immunofluorescence analysis of 53BP1 and γH2AX expression in WT and DJ-1−/− hNSCs. Data are shown as the mean ± SEM, n = 3. ns, not significant. Scale bar, 25 µm. (O) Cellular total ROS levels were determined by staining with the CM-H2DCFDA probe and quantified by FACS. Data are presented as the mean ± SEM, n = 3. ns, not significant. (P) Immunofluorescence analysis of 4-HNE expression in WT and DJ-1−/− hNSCs. Data are shown as the mean ± SEM, n = 3. ns, not significant. Scale bar, 25 µm

