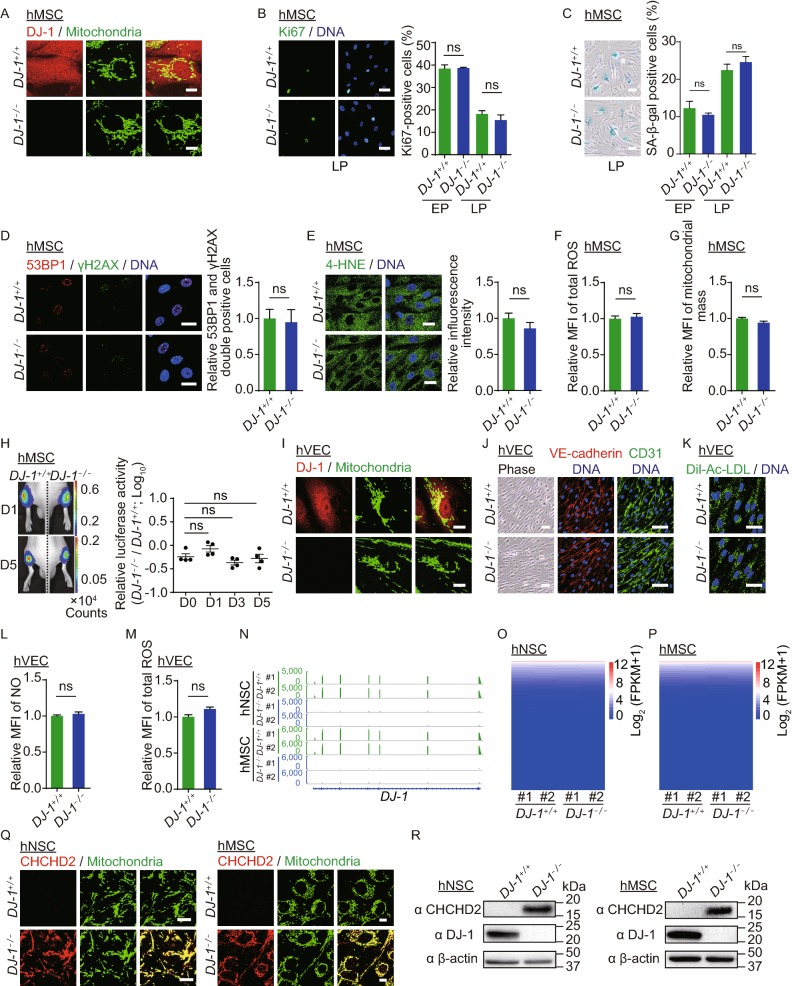
Figure 2.
DJ-1-deficient hMSCs and hVECs maintained cellular homeostasis. (A) Immunofluorescence analysis of DJ-1 expression in WT and DJ-1−/− hMSCs. Scale bar, 10 µm. (B) Immunofluorescence analysis of Ki67 expression in WT and DJ-1−/− hMSCs. Left, images of immunostaining for the Ki67 at P8 (LP, late passage). Right, quantification of Ki67-positive cells in WT and DJ-1−/− hMSCs at P4 (EP, early passage) and P8 (LP). Scale bar, 25 µm. Data are presented as the mean ± SEM, n = 3. ns, not significant. (C) SA-β-gal staining of WT and DJ-1−/− hMSCs. Left, images of SA-β-gal staining at P9 (LP, late passage). Right, quantification of SA-β-gal-positive cells in WT and DJ-1−/− hMSCs at P4 (EP) and P9 (LP). Scale bar, 50 μm. Data are presented as the mean ± SEM, n = 3. ns, not significant. (D) Immunofluorescence analysis of 53BP1 and γH2AX expression in WT and DJ-1−/− hMSCs. Data are presented as the mean ± SEM, n = 3. ns, not significant. Scale bar, 25 μm. (E) Immunofluorescence analysis of 4-HNE expression in WT and DJ-1−/− hMSCs. Data are shown as the mean ± SEM, n = 3. ns, not significant. Scale bar, 25 µm. (F) Cellular total ROS levels were determined by staining with the CM-H2DCFDA probe and analyzed by FACS. Data are presented as the mean ± SEM, n = 3. ns, not significant. (G) Mitochondrial mass levels were determined by staining with NAO probe and measured by FACS. Data are presented as the mean ± SEM, n = 3. ns, not significant. (H) Analysis of luciferase activity in the TA muscles of immunodeficient mice by an in vivo imaging system (IVIS). WT (1 × 10⁶, left) and DJ-1−/− (1 × 10⁶, right) hMSCs (passage 6) transduced with luciferase were implanted into the muscles of mice. Luciferase activities were imaged and quantified at days 0, 1, 3, and 5 after implantation. Data are presented as the mean ± SEM, n = 4. ns, not significant. (I) Immunofluorescence analysis of DJ-1 expression in WT and DJ-1−/− hVECs. Scale bar, 10 μm. (J) Phase-contrast images of hVECs to the left. Scale bar, 50 µm. Immunofluorescence staining of hVEC-specific markers, VE-cadherin and CD31 to the right. Scale bar, 25 μm. (K) Immunofluorescence staining of Dil-Ac-LDL in WT and DJ-1−/− hVECs. Scale bar, 25 µm. (L) Flow cytometry analysis of nitric oxide (NO) levels in WT and DJ-1−/− hVECs. Data are presented as the mean ± SEM, n = 3. ns, not significant. (M) Flow cytometry analysis of total ROS levels in WT and DJ-1−/− hVECs. Data are presented as the mean ± SEM, n = 3. ns, not significant. (N) Transcriptional signals of DJ-1 in WT and DJ-1−/− hNSCs and hMSCs. Data were normalized by RPKM at bin size of 10 bp. (O) Heatmap illustrating FPKM normalized expression level of each gene in WT and DJ-1−/− hNSCs. (P) Heatmap illustrating FPKM normalized expression level of each gene in WT and DJ-1−/− hMSCs. (Q) Immunofluorescence staining of CHCHD2 in WT and DJ-1−/− hNSCs (left) and hMSCs (right). Scale bar, 10 µm. (R) Western blotting analysis of CHCHD2 and DJ-1 expression in hNSCs (left), and hMSCs (right). β-actin was used as the loading control. (S) Scatter plot showing the fold change of mitochondrial-localized genes (adjusted P ≤ 0.05) in DJ-1−/− hNSCs compared to WT hNSCs. (T) Scatter plot showing the fold change of mitochondrial-localized genes (adjusted P ≤ 0.05) in DJ-1−/− hMSCs compared to WT hMSCs. (U) Transcriptional activity of CHCHD2 in WT and DJ-1−/− hMSCs measured by dual luciferase reporter assay. WT and DJ-1−/− hMSCs were co-transfected with pGL3-CHCHD2 promoter and Renilla plasmids. Data are presented as the mean ± SEM, n = 3. ***P < 0.001. (V) ChIP-qPCR assessment of the enrichment of DJ-1 at the CHCHD2 promoter in hESCs, hNSCs and hMSCs. Data are presented as the mean ± SEM, n = 4. ***P < 0.001, ns, not significant


