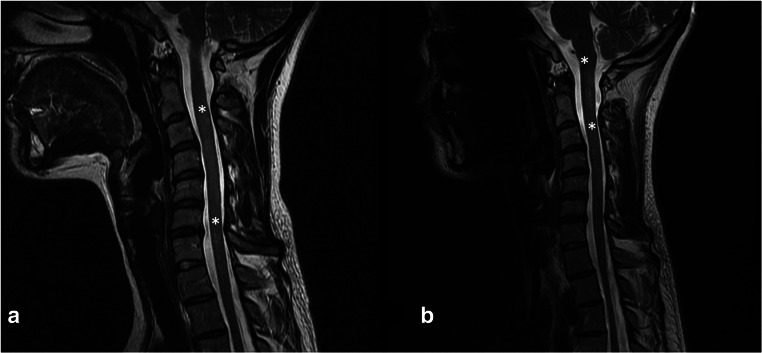
Fig. 5.
a Cervical spine MRI T2 sequences (May 2011). Diffuse hyperintensities of poorly defined borders, in C2–C3 down to the inferior plate of C5 vertebral body (asterisk). b Cervical spine MRI T2 sequences (2012). Hypertense image in in medulla-spinal border down to the inferior plate of C2 (asterisk)

