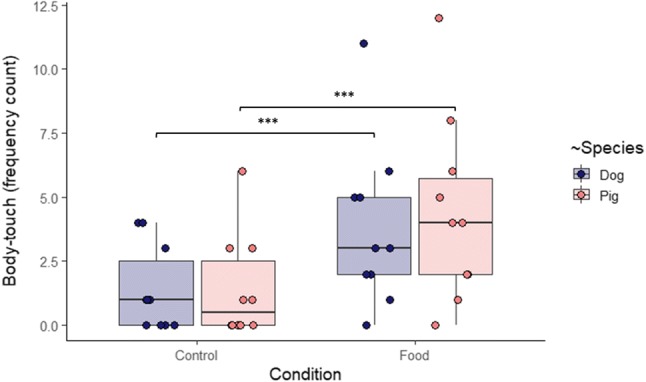
Fig. 2.

Frequency of pigs’ and dogs’ touching the experimenter’s body in the Control and Food conditions. Bold lines stand for the median, boxes indicate the interquartile range, and whiskers extend until the smallest and largest values (excluding outliers and extremities). The dots represent the individual data points. Significance code: '***' < 0.001 (see Online Resource 1)
