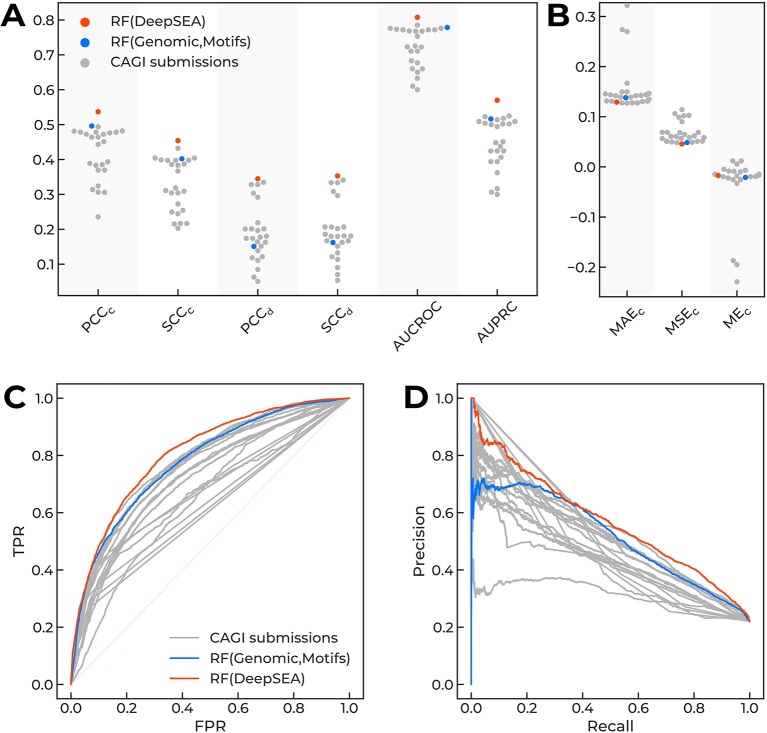
Figure 2.
The performance of different models predicting regulatory single-nucleotide variant (SNVs) of the CAGI “Regulation Saturation” challenge. Orange dots, Random Forest classifier using DeepSEA features. Blue dots, Random Forest classifier using features based on genomic data and sequence motif analysis. Grey dots, CAGI challenge submissions. (A, B) Different performance measures for prediction of expression direction (d) and confidence scores (c): Pearson (PCCc and PCCd) and Spearman (SCCc and SCCd) correlation coefficients, area under curve for receiver operating characteristic (AUCROC), area under precision-recall curve (AUPRC), mean absolute error (MAEc), mean squared error (MSEc), and mean error (MEc). (C, D) Receiver operating characteristics and precision-recall curves.

