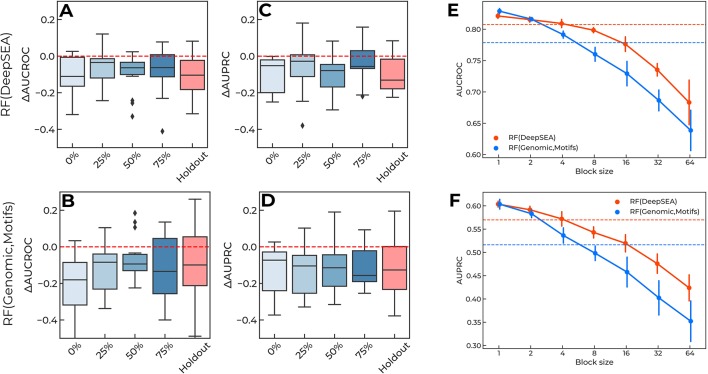
Figure 4.
(A-D) Training data of a single continuous block per reporter degrade performance of the prediction regulatory single-nucleotide variants (SNVs). X-axis, locations of training data blocks relative to the 5' ends of the reporters. Y-axis, the difference in AUCROC and AUPRC values for each model versus the baseline. The holdout of SNVs from each reporter is shown for the reference. Boxplots aggregate data from all reporters. Random Forest using DeepSEA features: (A) AUCROC, (C) AUPRC. Random Forest using genomic data and sequence motif features: (B) AUCROC, (D) AUPRC. (E–F) Shorter blocks in training data improve models performance due to information leakage. Orange lines: Random Forest classifier using DeepSEA features. Blue lines: Random Forest classifier using features based on genomic data and sequence motif analysis. Solid lines show the mean and standard deviation of 10 random samples with a fixed block length (X-axes). Dashed lines show the values reached in the original CAGI setup of the training data. (E) AUCROC values, (F) AUPRC values.

